

High-yield bond ETFs are paying over 6% right now. That sounds attractive — but Q4 2026 is a trickier environment than the headline yield suggests. Credit spreads have been quietly widening since late summer. CCC-rated spreads just hit a four-year high. Default rates are rising. The question isn’t whether HYG or JNK pay well. The question is whether the income compensates for the credit risk you’re taking on today.
The two biggest high-yield ETFs — HYG (iShares iBoxx $ High Yield Corporate Bond ETF) and JNK (SPDR Bloomberg High Yield Bond ETF) — both offer monthly income and broad diversification across hundreds of below-investment-grade corporate bonds. But they differ meaningfully in quality mix, expense ratio, and how much spread cushion they carry into year-end. This guide breaks down where credit spreads stand right now, how HYG and JNK differ, and whether the 6%+ yield is worth the risk heading into Q4 2026.
What Is a High-Yield Bond ETF — and Why Do Credit Spreads Matter?
High-yield bonds — also called “junk bonds” — are corporate bonds rated below investment grade: BB+ or lower by S&P, Ba1 or lower by Moody’s. Companies in this tier pay higher interest rates to compensate investors for a higher probability of default compared to investment-grade issuers.
A high-yield bond ETF bundles hundreds of these bonds into a single tradeable fund, giving you instant diversification across sectors and issuers. You collect monthly income distributions; the fund handles the underlying bond selection, reinvestment, and rebalancing. The income is real — but so is the risk.
The key metric every high-yield investor needs to understand is the option-adjusted spread (OAS): the extra yield a high-yield bond pays above a comparable Treasury of the same maturity. When OAS is narrow, investors are accepting little premium for the credit risk they’re absorbing. When OAS widens, bond prices fall (prices move inversely to yields), but future income becomes richer for new buyers.
In plain terms: wide spreads = prices down, future returns higher; tight spreads = prices elevated, future returns lower. Knowing where spreads are in the cycle is the single most important input when deciding whether to buy HYG or JNK today.
If you’re building a fixed-income foundation before adding credit risk, the breakdown of corporate bonds vs. Treasuries in 2026 walks through how investment-grade and high-yield spreads compare side by side.
Where Credit Spreads Stand in Q4 2026
As of October 2026, the ICE BofA US High Yield OAS sits around 326 basis points (3.26%) — up roughly 60 basis points from a September low of 266 bps. That single month of spread widening wiped out about 2% in NAV, even as monthly income distributions continued. The move places overall spreads at approximately the 62nd historical percentile: above the recent trough, but still far below crisis-level stress.
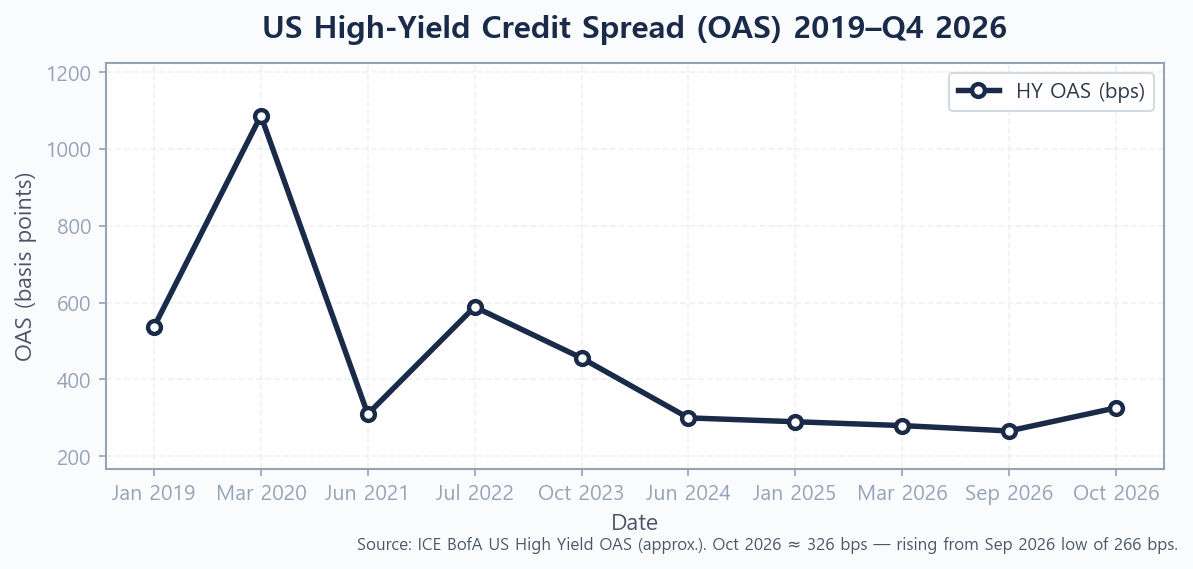
The video below from late September 2026 captures the moment credit spreads started accelerating — essential context for understanding where we are right now:
CCC Spreads at 4-Year Highs
The most important stress signal isn’t the overall index — it’s what’s happening at the lowest-rated tier. CCC-rated spreads have hit their widest level since 2022, signaling that the market is beginning to price in a genuine default cycle among the most leveraged borrowers. When CCC spreads blow out, the funds that hold them take disproportionate NAV hits relative to the broader high-yield index.
Both HYG and JNK hold roughly 10–12% of their portfolios in CCC or lower-rated bonds. That allocation seems small, but during credit stress those positions move much more violently than the BB and B-rated core of the portfolio.
What the OAS Numbers Tell Us
At 326 bps, the current market OAS remains below the long-run historical average of around 500 bps during normal economic expansions — and far below the 1,100 bps peak reached during COVID in March 2020. That tells you spreads could widen considerably further before reaching “crisis” levels.
The spread cushion — the income margin you earn above a Treasury — is roughly 3.3% per year. If spreads widen an additional 100 bps over the next 12 months, a fund with ~3–3.5 years of duration would lose roughly 3–3.5% in NAV. That would nearly wipe out the income advantage. If spreads widen 200 bps, you’re underwater for the year even after collecting every monthly distribution. History says this isn’t the base case — but it’s a tail risk worth pricing in.
HYG vs. JNK: How the Two Giants Differ
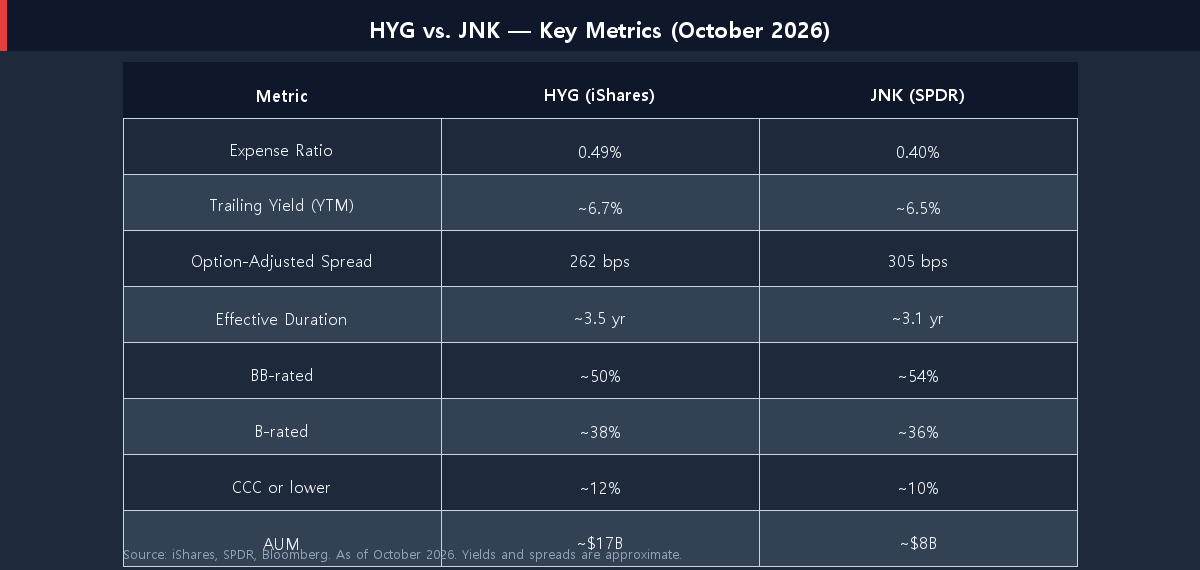
HYG and JNK are often described as nearly identical, but the differences matter — especially in a widening spread environment. Here’s how they compare as of October 2026:
Expense Ratios, Quality Mix, and Duration
JNK wins on cost: 0.40% versus HYG’s 0.49%. Over a 10-year holding period, that 9-basis-point gap compounds to a meaningful difference in total return. HYG, however, carries a lower OAS (~262 bps vs. ~305 bps for JNK), suggesting its underlying portfolio holds slightly higher-quality credits — which is likely why HYG showed less NAV drawdown during the March 2026 volatility spike (when the VIX hit 31.05 on March 27).
JNK’s higher OAS reflects a more aggressive quality mix and translates to a modestly higher CCC exposure. Both funds operate with short effective durations of roughly 3–3.5 years, which limits their sensitivity to interest rate changes compared to longer-duration bond funds. That short duration is actually a genuine advantage: rising Treasuries hurt these funds less than they would hurt a 10-year bond fund.
For context on why duration matters in the current environment, see: why short-duration bonds make sense in a 4% Treasury world.
Is the 6%+ Yield Worth It? A Scenario Analysis
The yield sounds compelling relative to a 10-year Treasury near 4.5% — a spread of roughly 2% in your favor. But yield-to-maturity on a bond ETF is not guaranteed income. It’s the forward yield assuming no defaults in the portfolio exceed the already-baked-in spread premium. Default rates rising above historical norms compress the realized return. Here’s how the math plays out across two plausible scenarios:
Bull Case: Spreads Hold, Carry Income Wins
If the US economy avoids a hard recession in 2026–2027 and high-yield spreads stabilize in the 300–400 bps range, investors in HYG or JNK collect 6–7% annually in monthly income with moderate price volatility. Default rates remain contained at 3–4% (roughly the historical long-run average). Total return over 12 months: approximately +5% to +7%, assuming spreads drift flat to modestly tighter. This is the base case in most 2026 credit market surveys.
Bear Case: Default Wave and Spread Blowout
If credit conditions deteriorate — say, spreads push past 600 bps as the leveraged buyout maturity wall of 2026–2027 produces a wave of distressed refinancings — NAV on HYG and JNK could fall 8–12%, erasing more than a full year of income. The CCC cohort (10–12% of both funds) would be hit hardest; distribution cuts would likely follow as defaults rise above 6–7%.
This scenario is not the consensus expectation, but it’s not implausible. The CCC spread signal at 4-year highs, combined with still-elevated financing costs, puts the most leveraged issuers under real pressure. A mild recession combined with continued tight monetary policy could tip spreads into that 500–700 bps zone within two to three quarters.
The Treasury rate backdrop matters as much as the credit cycle. If the 10-year Treasury yield holds near 4.5%, the all-in yield on HYG or JNK would push above 8–9% at 600 bps spreads — historically attractive enough to draw buyers and put a floor under prices. For the full rate outlook, see: 10-year Treasury yield outlook 2026.
How to Use High-Yield ETFs in Your Portfolio
High-yield bonds occupy a middle ground between investment-grade bonds and equities. During normal markets they behave like bonds — steady income, low volatility. During credit stress, they behave more like equities — sharp drawdowns, correlated with the S&P 500. That equity-like behavior in downturns limits their diversification benefit for investors who own both stocks and high-yield.
Practical sizing guidelines for Q4 2026:
- Position size: Most balanced portfolios cap high-yield at 10–20% of the fixed-income allocation — not 10–20% of the total portfolio. At current spread levels, lean toward the lower end of that range.
- Entry discipline: Spreads above 450–500 bps historically offer better risk/reward than today’s ~326 bps. Waiting for further widening before adding to position is a reasonable tactical stance.
- Fund selection: Prefer HYG for slightly higher quality and lower drawdown during stress; prefer JNK for lower expense ratio if you’re comfortable with marginally more credit risk.
- Alternatives: If capital preservation is the priority, short-term Treasuries or a high-yield savings account provide yield without equity-correlated credit risk.
The Verdict: Is High-Yield Worth the Risk in Q4 2026?
At ~326 bps OAS (October 2026), high-yield bonds offer a reasonable but not exceptional risk/reward profile for income investors. Spreads are wide enough to deliver meaningful carry above Treasuries — but they are not yet at the 450–500 bps level where the entry risk/reward becomes clearly compelling. The widening trend since September is a signal to watch closely: it suggests the market is repricing credit risk, but the move hasn’t reached distress territory.
Verdict by investor type:
- Income investors with a 2+ year horizon: A modest allocation (5–10% of your bond portfolio) in HYG or JNK makes sense as a yield enhancer at current levels. Monitor spreads monthly; if OAS crosses 450 bps, consider adding.
- Capital-preservation investors: Stick with investment-grade or short-duration Treasuries. The equity-like drawdown potential during credit stress isn’t worth the extra 2–3% yield over IG bonds.
- Tactical investors watching the credit cycle: The CCC spread signal and rising default environment suggest this is a moment for patience, not aggressive loading. Set an alert for OAS above 450 bps.
Found this useful? Bookmark it so you can revisit when the market moves. I publish practical investing breakdowns regularly — check back soon.
This article is for informational purposes only and is not investment advice. Do your own research before making any investment decisions.