
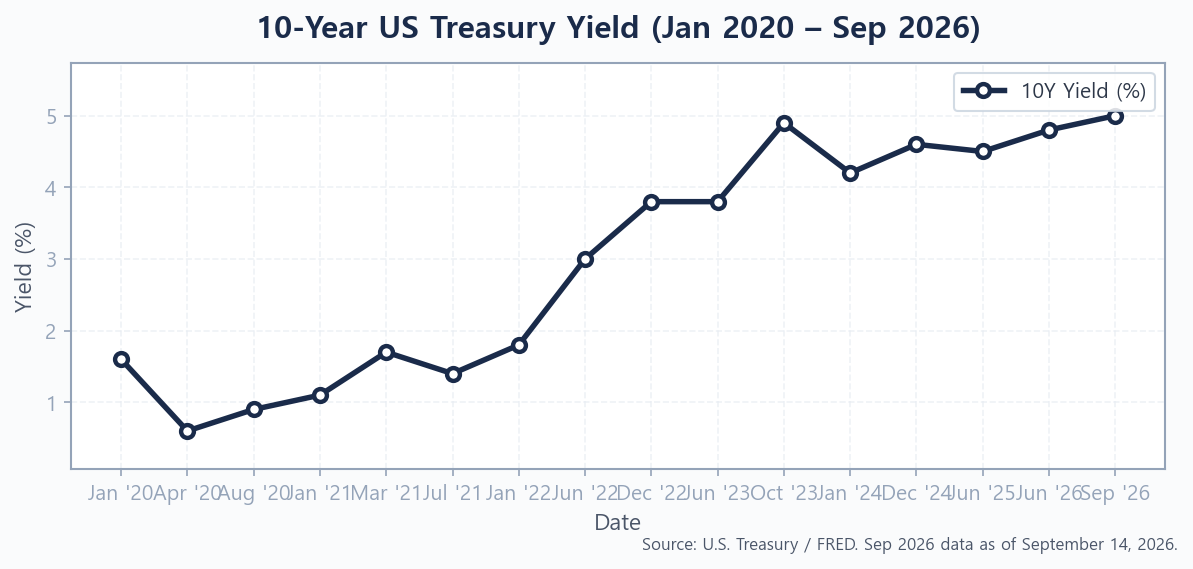
The 10-year US Treasury yield crossed 5% on September 14, 2026 — the first time since the 2007 pre-GFC era. For income investors, REIT holders, and growth-stock enthusiasts alike, that crossing matters more than a round number suggests. When the risk-free rate of the world’s reserve currency hits 5%, every other asset in your portfolio has to justify itself against that benchmark — or face a repricing. This article explains exactly what a 5% 10-year Treasury yield means for REITs, dividend stocks, and growth investors, and what you might want to reconsider in your portfolio right now.

Why the 10-Year Just Hit 5% — and Why It Matters
The Macro Drivers: Tariff-Driven Inflation + Fiscal Pressure
The September 2026 move to 5% didn’t happen in isolation. Three forces converged to push long-end yields higher. First, how the Fed’s higher-for-longer stance is pushing yields higher: with core PCE inflation still running above 3% — partly driven by sticky tariff pass-throughs — the FOMC has kept the federal funds rate elevated and signaled no imminent cuts. Second, the U.S. fiscal deficit widened significantly in FY2026, forcing Treasury to issue more long-duration bonds and pushing yields up through supply pressure. Third, foreign demand for US Treasuries softened as trade tensions kept several sovereign buyers on the sidelines.
The result: the 10-year Treasury yield, which averaged around 4.0–4.5% in early 2026, climbed steadily through summer and broke the psychological 5% level in mid-September (Source: CNBC / U.S. Treasury, as of September 14, 2026).
Historical Context: 5% Was the Norm Before the 2008 GFC
It’s easy to forget that 5% was a completely ordinary yield for the 10-year Treasury throughout the 1990s and most of the 2000s. What changed was the post-2008 era of quantitative easing and near-zero rates, which conditioned a generation of investors to think of 2–3% as “normal.” That era is over. The current 5% yield is not a crisis — it is a normalization, albeit a painful one for assets priced in a zero-rate world.
Understanding this context helps clarify the stakes. For more background on the 10-year Treasury yield outlook for 2026, the prior piece covers where yields were heading before this latest leg higher. The current 5% mark changes many of the calculus points outlined there.
How REITs Are Hit the Hardest
The Cap-Rate / Discount-Rate Squeeze
Real estate investment trusts are among the most interest-rate-sensitive assets in public markets, and a 5% Treasury yield puts them in a particularly difficult position. The reason is structural: REIT valuations depend heavily on cap rates, which are roughly defined as:
Cap Rate ≈ Risk-Free Rate + Risk Premium − Expected Growth
When the risk-free rate (proxied by the 10-year Treasury) rises by 1 percentage point, cap rates tend to rise by a similar amount — which means property values must fall to maintain those cap rates. Higher cap rates compress net asset value (NAV), which is a core input to REIT share prices. The impact is particularly sharp for long-lease REITs (net-lease, healthcare, office) where you are essentially holding a very long-duration fixed-income-like instrument inside an equity wrapper.
Mortgage REITs vs. Equity REITs: Who Suffers More?
Not all REITs are created equal under rising rates:
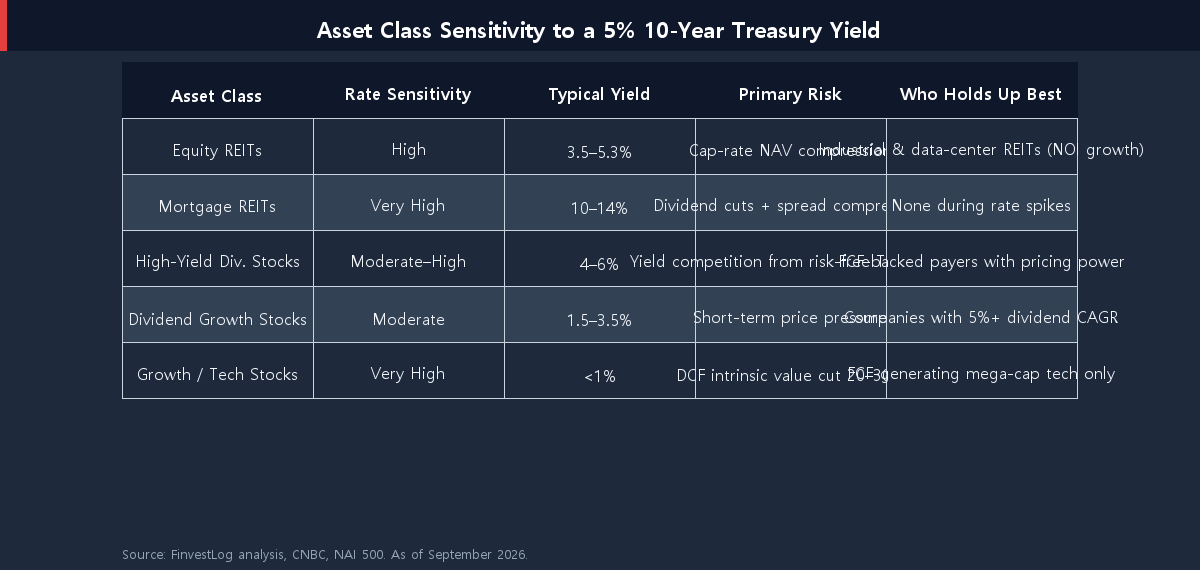
- Equity REITs (own physical properties) face NAV compression and higher refinancing costs. However, REITs with strong rent escalators — particularly industrial and data-center REITs — can grow NOI fast enough to partially offset the discount-rate headwind.
- Mortgage REITs (mREITs) like AGNC Investment (NASDAQ: AGNC, ~13.5% yield as of September 2026) carry explicit interest-rate risk on both sides of their balance sheet. When short-term borrowing costs remain high and long-end yields also rise, the spread they earn on their mortgage portfolios can compress dramatically. mREIT yields look attractive on paper but frequently involve dividend cuts during rate spikes.
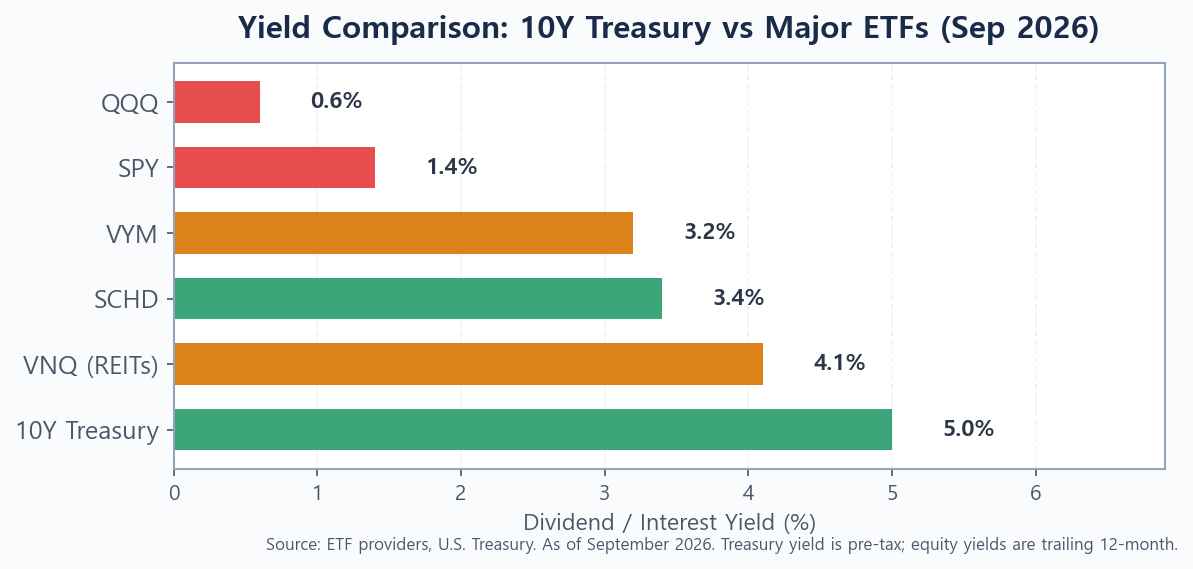
A useful framework: if a REIT’s dividend yield is already at or below 5%, it is competing directly with risk-free Treasuries on income terms alone — and losing. Realty Income (NYSE: O), for example, yields about 5.3% (Source: Realty Income, as of Q2 2026), which still clears the Treasury hurdle — but just barely, and only before accounting for the liquidity premium and equity risk investors demand. For a deeper comparison, see our analysis of REITs vs dividend ETFs for passive income in 2026.
Sectors Within REITs Still Showing Resilience
Despite the macro headwind, some REIT subsectors are holding up better. Industrial REITs tied to e-commerce logistics and data-center REITs benefiting from AI infrastructure demand have strong secular tailwinds that can override short-term rate sensitivity. Investors looking to maintain REIT exposure in a 5% yield world may consider tilting toward these operationally growing subsectors rather than purely yield-seeking net-lease or retail names.
What It Means for Dividend Stocks
The “Yield Competition” Reality: Bonds Are Finally a Real Alternative
For most of the 2010s and early 2020s, dividend stocks thrived partly because bonds offered almost nothing. A stock paying 3% looked great when 10-year Treasuries yielded 1.5%. At 5% on the 10-year, that equation reverses. Now investors can earn 5% with zero credit risk, no equity volatility, and no need to analyze management quality or payout ratios.
This “yield competition” doesn’t automatically make dividend stocks bad — but it does reset the hurdle. Stocks with dividend yields below 4–5% must now justify their premium through capital appreciation potential, dividend growth, or portfolio diversification benefits that bonds can’t provide.
Which Dividend Payers Can Defend Their Premium
The dividend stocks most likely to hold their ground at 5% Treasury yields share a few common traits:
- Strong free cash flow coverage: A payout ratio below 60% with growing FCF gives investors confidence the dividend is secure and growing.
- History of dividend growth: The S&P 500’s dividends have grown at roughly 5.7% annually over the past 60 years (Source: S&P Dow Jones Indices). Dividend growers compound income over time — something a 5% fixed Treasury cannot.
- Pricing power in an inflationary environment: Companies that can raise prices (consumer staples leaders, dominant healthcare names) protect real dividend purchasing power in ways bonds cannot.
For sector-specific picks, see our breakdown of the best high-yield dividend ETFs for 2026.
Dividend Growth Stocks vs. High-Yield Stocks in a 5% World
Here’s a counterintuitive observation: dividend stocks are finally beating the S&P 500 in 2026, with SCHD up sharply year-to-date as of mid-2026 — yet rising yields make the highest-yielding names (VYM, DVY constituents) more vulnerable, not less. The distinction is between yield-chasers and quality dividend growers. In a 5% Treasury world, chasing the highest nominal yield in equities is a trap if that yield is not backed by earnings growth. Dividend growth ETFs (DGRO, SCHD) tend to survive rate cycles better than pure high-yield strategies because their underlying companies can raise dividends as rates rise.
Growth Stocks and the DCF Math Problem
Why a 1% Rise in WACC Can Cut Intrinsic Value by 20–30%
Growth stocks are the most exposed equity category to rising long-term rates — and the math is unambiguous. Growth stocks derive most of their present value from earnings and cash flows expected years or decades into the future. Under a discounted cash flow (DCF) model, all those future cash flows are divided by the discount rate (WACC) at every step, and the terminal value — often the single largest component of intrinsic value — is divided by (WACC − growth rate).
Mathematically, a 1 percentage point increase in WACC applied to a high-multiple, long-duration equity typically reduces intrinsic value by 20–30% (Source: NAI 500, heygotrade.com, September 2026). For a stock trading at 40x forward earnings with most value attributed to a 10+ year terminal period, a move from a 4% Treasury to a 5% Treasury is not a rounding error — it is a structural repricing.
Richly Valued AI and Tech: Biggest Headwind
The segment most exposed is the highest-multiple growth cohort: AI platform companies, SaaS names trading at elevated revenue multiples, and early-stage tech with no near-term profits. As the discount rate rises, the “long-duration” nature of these stocks makes them the first to reprice. Broad index exposure through QQQ or the S&P 500 growth slice carries this duration risk, even if it isn’t labeled as such.
That said, mega-cap tech companies with massive free cash flow generation (not just revenue) are partially insulated. Their near-term earnings are real and growing, limiting how much of their value sits in distant terminal projections. The clearest risk lies in names where the bull case depends almost entirely on monetization years away.
Value vs. Growth Rotation: Reading the Signals
Historically, growth stocks underperform value stocks when the 10-year Treasury yield rises rapidly. The late 2022 growth selloff (when yields went from 1.5% to 4%) and the late 2023 episode (approaching 5%) both followed this pattern. The current move to 5% in September 2026 fits the same template. How Fed rate decisions affect the stock market covers the broader transmission mechanism, but the REIT and growth stock channels are the most direct.
Portfolio Playbook for Late 2026
How to Position Across All Three Asset Classes
Given a sustained 5% 10-year yield, here is a practical framework for each category:
REITs: Reduce exposure to pure yield plays (net-lease REITs with thin dividend premiums over the Treasury). Maintain or add to industrial and data-center REITs with NOI growth above the cap-rate headwind. Avoid mREITs unless your time horizon and risk tolerance is explicit.
Dividend stocks: Favor dividend growers over dividend yielders. Screen for payout ratios below 65%, 5-year dividend growth rate above 5%, and free-cash-flow yield above the current Treasury. The total return story (yield + dividend growth + modest price appreciation) should still beat a static 5% bond over a 5–10 year horizon for quality names. See the Treasury yield curve steepening context for how duration risk interacts with these decisions.
Growth stocks: Apply greater valuation discipline. A 40x P/E that was arguably fair at a 3% 10-year is harder to justify at 5%. Trim positions where near-term earnings visibility is low and the bull case requires sustained low rates. Concentration in AI infrastructure names with actual FCF generation is more defensible than early-stage growth plays.
What NOT to Do When Yields Spike
A yield spike to 5% triggers predictable emotional reactions that often prove costly in hindsight:
- Don’t panic-sell everything rate-sensitive at once. Rate spikes that push yields to multi-year highs often overshoot before normalizing. Selling REITs or long-duration equities at the peak of a yield spike locks in the worst entry/exit combination.
- Don’t chase mREIT yields. A 13% yield in a rising-rate environment has a high probability of a dividend cut embedded in it.
- Don’t assume the yield keeps rising indefinitely. At 5%, Treasuries are now attracting fresh buying from yield-starved pension funds, insurance companies, and foreign central banks. That demand acts as a natural ceiling.
Conclusion: A 5% Yield Isn’t the End — It’s a Repricing
A 5% 10-year Treasury yield is not a catastrophe — it is a recalibration. It forces every asset class to justify its risk premium against a genuinely competitive risk-free alternative for the first time in over a decade. REITs must grow their way through the cap-rate headwind; dividend stocks must grow their dividends faster than the static yield; growth stocks must prove their future earnings fast enough to survive a higher discount rate. The investors who treat this as an opportunity to upgrade portfolio quality — rather than a reason to abandon equities entirely — are most likely to benefit when yields eventually stabilize.
For the broader rate context driving this move, the analysis of whether the Fed will hike in 2026 and its higher-for-longer implications remains essential reading. Bookmark this page to revisit the framework as the rate picture evolves through Q4 2026.
This article is for informational purposes only and is not investment advice. Do your own research before making any investment decisions.