
Warren Buffett once called it “the best single measure of where valuations stand at any given moment.” The Buffett Indicator — total US stock market capitalization divided by GDP — crossed 195% years ago and has kept climbing. As of September 2026, it sits near 237%, roughly 2.6 standard deviations above its long-run average. That is not a typo. So does this mean the US stock market is dangerously overvalued in 2026, or has the indicator lost its usefulness in a world of global mega-caps and structurally lower interest rates? This guide walks through the data, the honest debate, and five portfolio moves worth considering.
What Is the Buffett Indicator — and Why Warren Buffett Called It His Favorite Metric
The Buffett Indicator made its public debut in a 2001 Fortune article. Buffett described the ratio of total US stock market capitalization to US GDP as the single best snapshot of aggregate market valuation. The calculation sounds simple — and it is.
The Simple Formula Behind the Ratio
The most common version uses the Wilshire 5000 Total Market Index as the proxy for total market cap and nominal US GDP as the denominator. Some variants use GNP. All versions tell roughly the same story: when the ratio is low, stocks are cheap relative to the underlying economy; when the ratio is high, investors are paying a large premium for future growth.
- Below 75%: Historically undervalued
- 75–90%: Fairly valued
- 90–115%: Modestly overvalued
- Above 115%: Significantly overvalued
- Above 150%: Extreme territory, historically rare
Why “Over 100%” Is Not Automatically a Red Flag
A ratio above 100% simply means investors collectively value US public companies at more than one year of economic output. That is entirely possible if profit margins are expanding, interest rates are low, or the economy is expected to grow fast. Context matters more than the raw number alone. Still, at 237%, the gap between market value and economic output is historically extraordinary.
For a broader picture of what drives stock valuations, see our breakdown of how Fed rate decisions affect the stock market.
Where the Buffett Indicator Stands in 2026 — and What History Says Happens Next
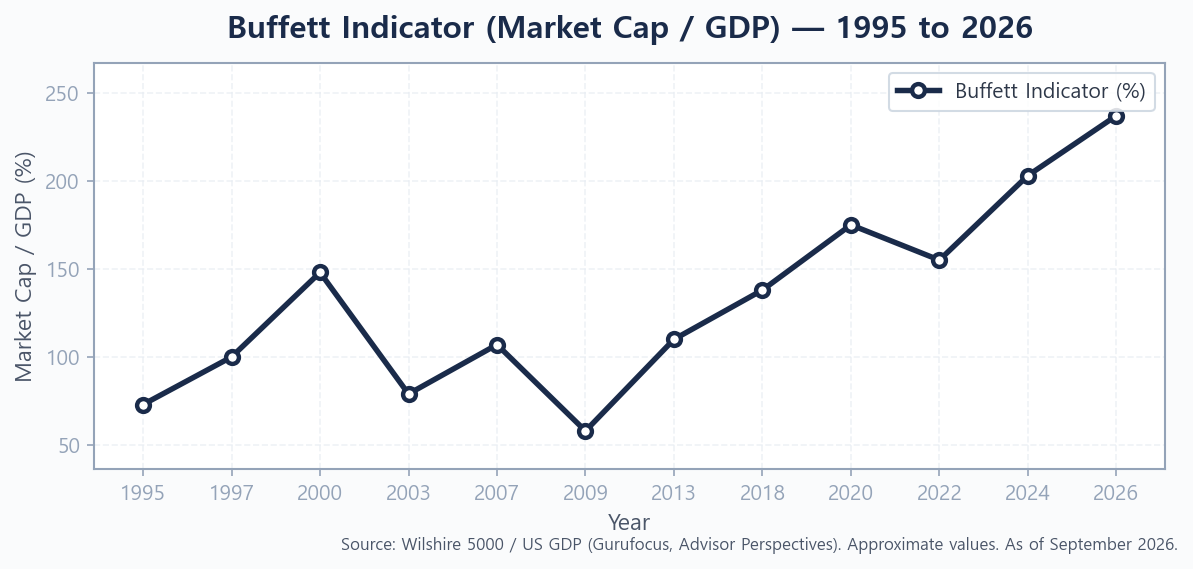
The indicator crossed 195% in the post-COVID bull run and never looked back. By June 2026, several data providers pegged it at 237–244%, representing the highest reading in recorded history. To put that in context, the dot-com bubble — widely regarded as the most extreme US equity mania — peaked at roughly 148% before the Nasdaq fell 78% and the S&P 500 fell 49%.
The Three Previous Times the Indicator Crossed 150%
- Dot-com peak (2000): Indicator hit ~148%. The S&P 500 subsequently lost roughly 49% peak to trough over two and a half years.
- Pre-GFC peak (2007): Indicator was near 107% — elevated but not extreme. The S&P 500 still fell ~57%.
- Post-COVID highs (2021): Indicator crossed 200% for the first time. The S&P 500 corrected ~20% in 2022 as the Fed began its fastest rate-hike cycle in four decades.
None of these previous peaks reached the 237% level seen today. That either means the current reading is an unprecedented bubble — or it reflects a genuinely new structural reality. Both camps have credible arguments.
The Bull Case: Is the Buffett Indicator Broken in a Structurally Different Era?
Critics of the indicator raise four legitimate points. First, US companies now earn a substantial share of revenues abroad — Apple, Microsoft, and Alphabet are global businesses, not domestic ones, so measuring them against US GDP alone understates their earnings power. Second, a decade of near-zero interest rates raised the theoretical fair-value P/E for all assets. Third, corporate profit margins have expanded structurally over 30 years. Fourth, the “Magnificent Seven” mega-caps (Apple, Nvidia, Microsoft, Amazon, Alphabet, Meta, Tesla) represent genuine earnings machines, not pure speculation.
Even Buffett himself has not been selling wholesale into the elevated market, though Berkshire Hathaway’s cash pile reached record highs in 2024–2025 — a quiet signal worth noting. To understand how the current rate environment reinforces or contradicts these valuations, see Will the Fed Hike Rates in 2026?
The Buffett Indicator Isn’t the Only Warning Sign: Four Other Valuation Metrics to Watch
Relying on a single metric is always dangerous. The picture becomes more concerning when multiple independent measures point the same direction.
Shiller CAPE Ratio
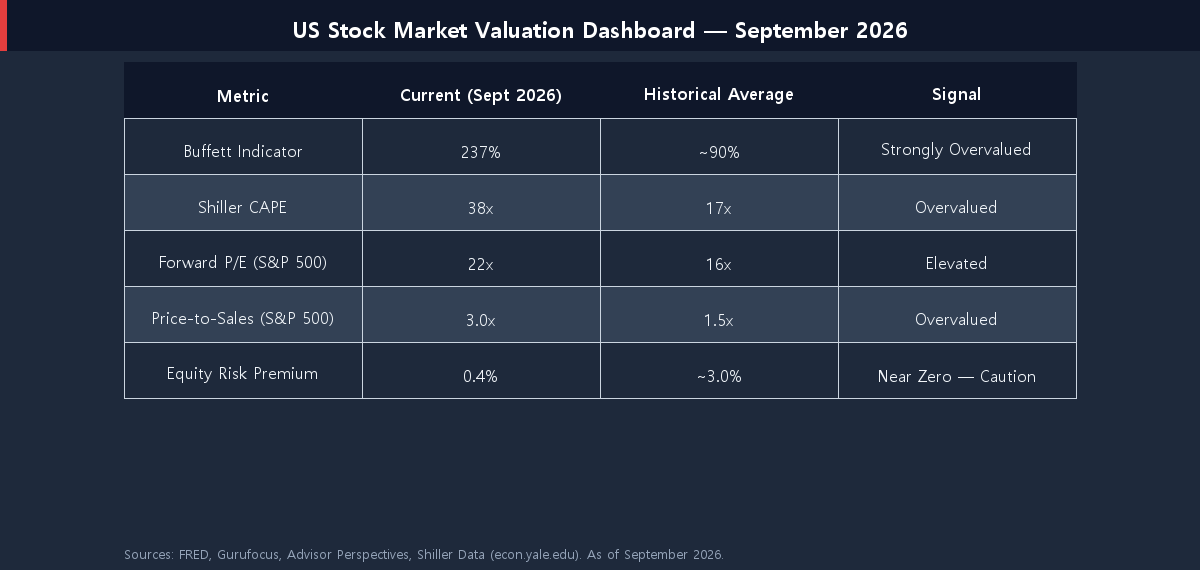
The cyclically adjusted price-to-earnings (CAPE) ratio — developed by Nobel laureate Robert Shiller — smooths earnings over 10 years to reduce cyclical noise. As of September 2026, the Shiller CAPE stands near 38x, versus a historical average of roughly 17x. Only the dot-com peak briefly exceeded this level. Research by Shiller and others shows that high CAPE reliably predicts lower 10-year real returns, not an imminent crash.
Forward P/E vs. Long-Run Average
The S&P 500 forward P/E — price divided by consensus next-12-months earnings — currently sits around 22x, versus a long-run average near 16x. Elevated, but less extreme than the Buffett Indicator because it builds in analyst growth expectations, which are currently optimistic.
Price-to-Sales Ratio
Price-to-sales cannot be manipulated by accounting or buybacks. The S&P 500 P/S ratio is near 3.0x, roughly double its long-run average of ~1.5x. This is harder to explain away — companies would need to sustain structurally higher profit margins indefinitely to justify current prices on a sales basis.
Equity Risk Premium (Near Zero)
The equity risk premium (ERP) — the extra return stocks offer over risk-free bonds — has collapsed. With 10-year Treasury yields above 4.5% (Source: U.S. Treasury, as of September 2026) and forward earnings yields near 4.5%, the ERP is near 0.4%, versus a historical average of roughly 3%. Stocks are offering almost no extra reward for the additional risk, compared to sitting in Treasuries.
Does a High Buffett Indicator Actually Predict a Crash?
Here is the uncomfortable truth: high valuations are terrible short-term timing tools. The Buffett Indicator crossed 100% in the mid-1990s. Investors who sold then missed the entire second half of the dot-com boom. The indicator stayed elevated for years before the eventual collapse. Research from firms like GMO and AQR consistently shows that valuation metrics explain only long-run returns — not what happens over the next 12 or even 24 months.
What high valuations do predict, with reasonable reliability, is lower 10-year real returns. Studies suggest that buying the S&P 500 at a Shiller CAPE above 30x has historically delivered annualized real returns in the low single digits (1–4%) over the following decade, versus 7–9% from average valuations. Not a crash — but a decade of grinding, subpar performance that erodes purchasing power.
The video below, published in May 2026, explores the strongest critique of the Buffett Indicator and why many professional investors still track it despite its known flaws:
If you are also worried about concentrated AI-driven risk inside the index, How to Protect Your Portfolio From an AI Bubble in 2026 walks through five specific hedges.
5 Portfolio Moves to Consider When Valuations Are Stretched
Stretched valuations are not a signal to exit stocks entirely. They are a signal to review your allocation and ensure you are being compensated for the risks you are taking.
- Rebalance — don’t react. If your stock allocation has drifted above your target (likely, after several years of strong US equity returns), trimming back to target is a disciplined, non-emotional response. See How to Rebalance Your Portfolio When Interest Rates Are Rising for a step-by-step framework.
- Add international diversification. Valuations outside the US — in Europe, Japan, and parts of emerging markets — are meaningfully cheaper by most metrics. A simple 3-fund portfolio naturally includes international exposure that many US-focused investors currently lack.
- Consider a quality or value tilt. Within US equities, sectors like energy, healthcare, and financials trade at below-market multiples. An equal-weight approach or a value-tilted ETF can reduce concentration risk from the top-heavy Magnificent Seven.
- Hold meaningful cash or short-term bonds. With Treasury bill yields around 4–5% (Source: U.S. Treasury, as of September 2026), sitting in short-term Treasuries while waiting for better opportunities has a real cost of only ~0–1% versus history. Consider gold as a 5–10% portfolio hedge during periods of extreme market stress.
- Extend your time horizon, not your risk. If valuations are likely to drag 10-year returns down, the answer is not to take more risk chasing returns — it is to invest more, save more, and let compounding do the work over a longer window.
Conclusion
The Buffett Indicator at 195%+ — and now climbing past 237% — is a legitimate signal that the US stock market is priced for a near-perfect future. Multiple independent valuation metrics (Shiller CAPE, forward P/E, P/S, equity risk premium) tell the same story. That does not mean a crash is imminent; valuation is a poor short-term timing tool. What it does suggest is that long-term forward returns from US large-cap equities are likely to be lower than the historical norm, and that portfolio resilience — through diversification, rebalancing, and a realistic return outlook — matters more than ever in 2026.
If this breakdown was useful, bookmark it and revisit when the market moves. I publish practical investing analysis regularly — check back soon.
This article is for informational purposes only and is not investment advice. Do your own research before making any investment decisions.