
For years, VOO — Vanguard’s S&P 500 ETF — has been the default answer to “which index fund should I own?” Its near-zero cost, broad diversification, and stellar long-term track record have earned it near-universal praise. But in 2026, a quieter rival is stepping into the spotlight: RSP, the Invesco S&P 500 Equal Weight ETF. RSP holds the same 500 companies as VOO — yet it has outperformed it year-to-date. So is this a meaningful shift, or just short-term noise? This guide breaks down the equal-weight vs market-cap debate with actual numbers so you can decide for yourself.

What Are Equal-Weight and Market-Cap ETFs? (The Core Difference)
Both VOO and RSP track the S&P 500 index — meaning they own shares in the same 500 large-cap US companies. The critical difference is how much they hold of each company.
How VOO Works: Market-Cap Weighting
VOO is market-cap weighted: bigger companies get a bigger slice. Apple, Microsoft, Nvidia, Amazon, and Alphabet — the so-called Magnificent Seven — collectively dominate the fund. VOO’s top five holdings (NVDA, AAPL, MSFT, AMZN, GOOGL) make up roughly 28% of the entire portfolio. The technology sector alone accounts for around 33% of VOO’s assets. When mega-cap tech rises, VOO soars. When it stalls, VOO lags.
How RSP Works: Equal Weighting
RSP assigns every S&P 500 constituent an equal weight — roughly 0.2% each. A regional bank in Kansas gets the same allocation as Apple. This means RSP’s top five holdings account for only about 1% of the portfolio, and technology represents just 14% of assets. Equal weighting effectively acts as a systematic rebalancing mechanism: every quarter, the fund trims recent winners and adds to laggards, enforcing discipline that most investors struggle to apply manually.
VOO vs RSP Performance: 2026 vs Long-Term
The performance story is two-sided — and understanding both sides is essential before making any portfolio decision.
2026 Year-to-Date — RSP’s Breakout Year
Through July 2026, RSP has returned +13.01% year-to-date versus VOO’s +10.23% (Source: PortfoliosLab, as of July 2026). That ~2.8-percentage-point gap reflects a broader market rotation: the Magnificent Seven slowed sharply in early 2026, while the other 493 companies in the index accelerated. The result is that the equal-weight approach — with its deliberate underweight in mega-cap tech — benefited from exactly the environment that market-cap weighting fears most.
This isn’t the first time RSP has led during a Mag-7 consolidation phase. In corrections and value-led rallies, equal weighting historically shines. The question is always: how long does the rotation last?
10-Year Annualized Returns — VOO’s Long-Term Edge
Zoom out to a 10-year horizon, and the picture reverses. Over the past decade, VOO delivered an annualized return of 15.30% against RSP’s 12.06% (Source: PortfoliosLab). That 3.24% annual gap compounds dramatically over time. On a $100,000 investment over 10 years, the difference amounts to roughly $70,000 in final portfolio value — a gap driven almost entirely by mega-cap tech’s outsized decade.
The lesson: RSP outperforms in broad-market, value-tilted environments; VOO outperforms when concentration in large-cap growth pays off. Neither approach dominates unconditionally.
Sector Weights — Where the Real Risk Difference Lives
The most practical way to understand VOO vs RSP is through sector exposure. The two funds are not just differently weighted versions of the same bet — they represent meaningfully different risk profiles.
Moving from VOO to RSP cuts your technology exposure from roughly 33% down to 14%. In exchange, you get a far larger slice of industrials (8.3% → 15%), real estate (1.8% → 6.1%), financials, utilities, and materials. RSP effectively tilts toward the “other 493” — mid-cap-sized large caps that rarely make financial headlines but collectively drive a large share of US economic activity.
This isn’t simply diversification for its own sake. It’s a structural bet on whether US equity leadership will remain concentrated in a handful of technology giants, or rotate more broadly across sectors. If you believe AI capital expenditure, regulatory pressure on big tech, or valuation mean-reversion will weigh on the Mag 7, RSP gives you a natural hedge built into the index itself.
Expense Ratio, Dividend Yield, and Drawdown Risk
Three metrics that often get overlooked in the headline performance comparison deserve closer attention.
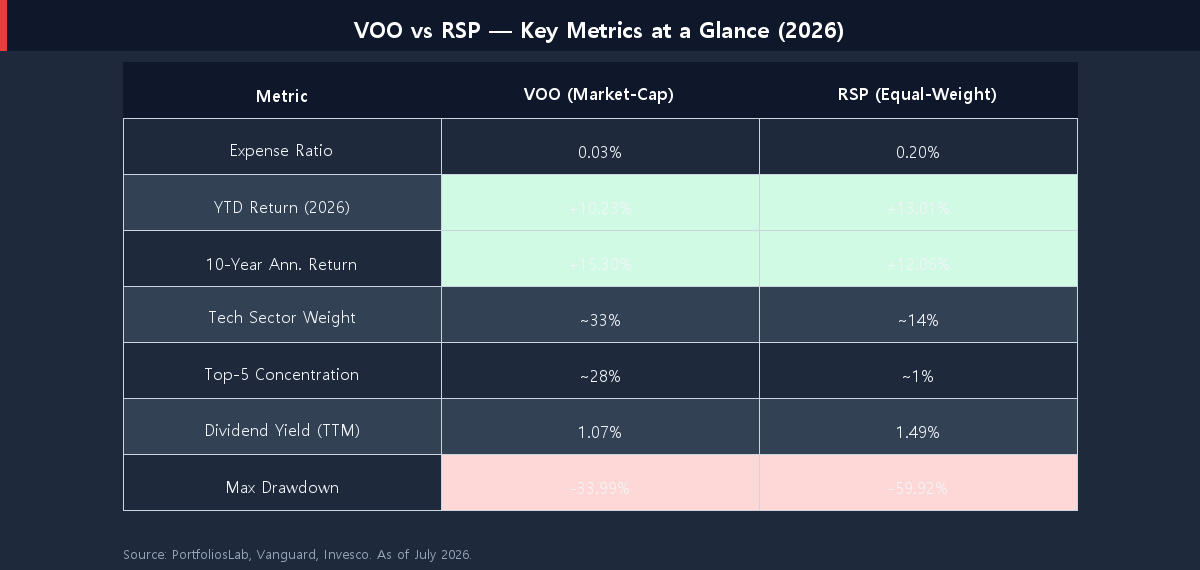
Expense ratio: VOO charges just 0.03% per year — one of the cheapest funds on the market. RSP charges 0.20%, nearly seven times more. On a $100,000 portfolio, that’s roughly $170 extra per year in fees. Over 20 years, compounded, this drag is meaningful — and it’s one reason RSP needs to consistently outperform to justify its higher cost. For a deeper look at how expense ratios compound into large losses over time, see What Is an ETF Expense Ratio? Why It Eats Returns (2026).
Dividend yield: RSP yields approximately 1.49% TTM versus VOO’s 1.07% (Source: PortfoliosLab). Equal weighting naturally raises exposure to dividend-paying sectors — utilities, financials, real estate — explaining the higher yield. For investors prioritizing income over growth, this is a modest but real advantage. If high-yield dividend investing interests you, see our roundup of Best High-Yield Dividend ETFs for 2026.
Drawdown risk: This is the most important and least discussed difference. VOO’s maximum drawdown since inception is -33.99%; RSP’s is -59.92% (Source: PortfoliosLab). RSP’s equal weighting introduces more exposure to smaller S&P 500 constituents — companies that are more cyclical and more sensitive to credit conditions. In a severe credit crisis or deep recession, RSP historically falls harder and takes longer to recover.
Who Should Choose RSP Over VOO in 2026?
The Case for RSP
- You believe mega-cap tech is overvalued or facing near-term headwinds (regulatory pressure, AI capex plateau, rate sensitivity).
- You want built-in rebalancing discipline. RSP’s quarterly rebalance systematically trims winners and adds to laggards — a behavior that most individual investors struggle to follow manually.
- You’re concerned about index concentration. Owning VOO means approximately 35% of your “diversified” S&P 500 allocation is determined by just 10 companies. RSP distributes that risk across all 500.
- You have a long-enough horizon to ride out drawdowns. If you can hold through a 50–60% drawdown without selling, RSP’s sector breadth may reward patience during value-led cycles.
The Case for Staying in VOO
- Cost efficiency compounds over decades. The 0.17% annual fee gap between RSP and VOO is small today, but over a 30-year horizon it can reduce your ending portfolio value by tens of thousands of dollars — even if returns are equal.
- Long-term track record still favors market-cap weighting. The 10-year gap of 3.24%/year in VOO’s favor is not a fluke. If US equity markets continue to reward companies that generate the most profit and return the most capital, the largest companies will continue to dominate.
- Lower drawdown risk. VOO’s -33.99% maximum drawdown versus RSP’s -59.92% matters enormously for investors who may need to access capital or who have shorter time horizons.
- Simplicity. If you’re building a straightforward, low-maintenance portfolio, VOO as your core US equity holding is hard to beat. See How to Build a Simple 3-Fund Portfolio in 2026 for a practical framework where VOO fits naturally.
If you’re looking for a middle ground, some investors split the difference — holding 70–80% in VOO for cost efficiency and long-term returns, and 20–30% in RSP for sector diversification and rebalancing discipline. This blend reduces concentration risk without fully sacrificing VOO’s cost advantage.
Whether you end up staying with VOO or rotating toward RSP, the same principle applies: understand the income side of your portfolio. Comparing SCHD vs VIG for dividend growth exposure is a useful complement to this market-cap vs equal-weight decision — particularly for investors who want both growth and rising income.
Conclusion
The equal-weight vs market-cap debate does not have a universal winner. RSP’s 2026 outperformance is real and reflects a genuine regime shift away from mega-cap tech dominance. But VOO’s 10-year track record, near-zero expense ratio, and lower drawdown risk remain compelling arguments for sticking with the market-cap-weighted approach over full investment cycles.
The most important question is not “which fund performed better this year?” It’s “which structure fits my investment horizon, risk tolerance, and conviction about where the next decade’s equity returns will come from?” Use the data above to answer that question honestly — then pick the approach you can hold through a down cycle without second-guessing.
Found this useful? Bookmark it so you can revisit when the market moves. I publish practical investing breakdowns regularly — check back soon.
This article is for informational purposes only and is not investment advice. Do your own research.