
When you buy an ETF, no one hands you an invoice for the management fee. There is no monthly charge on your statement and no line item to approve. Yet every single year, a slice of your money is removed quietly and automatically. That slice is the ETF expense ratio, and while the number looks tiny — often less than 1% — it can erase tens of thousands of dollars from a long-term portfolio. This guide explains exactly what an ETF expense ratio is, how the fee is deducted without you noticing, what real funds charge in 2026, and why the difference between 0.03% and 1% matters far more than it appears.
What an ETF Expense Ratio Actually Is
An ETF expense ratio is the annual fee a fund charges to cover its operating costs — portfolio management, administration, recordkeeping, and marketing. It is expressed as a percentage of the money you have invested in the fund. A 0.20% expense ratio means that for every $10,000 you hold, the fund keeps about $20 per year to run itself.
The key word is annual. The expense ratio is not a one-time entry fee or a trading commission. It is charged every year you stay invested, whether the fund goes up, down, or sideways. A passive index ETF that simply tracks the S&P 500 has very low running costs, so its expense ratio is small. An actively managed ETF, where a team picks stocks and trades often, costs more to operate — and that higher cost shows up as a higher expense ratio.
How the Fee Is Quietly Deducted (You Never Get a Bill)
Here is the part most beginners miss. You never pay the expense ratio directly. Instead, the fund deducts a tiny fraction of the fee from its assets every single day, before its share price is published. By the time you check your balance, the cost has already been taken out of the fund’s net asset value.
This is why the fee feels invisible. The returns you see quoted for any ETF are already net of the expense ratio. There is no withdrawal from your account, no notification, and nothing to confirm. The money simply never appears in your balance in the first place. That silence is exactly why the expense ratio is so easy to ignore — and so important to check before you buy.
Real ETF Expense Ratios Compared (2026)
Expense ratios vary enormously depending on whether a fund is passively or actively managed. The table below compares several widely held ETFs, along with the equity-ETF average, and translates each percentage into the annual dollar cost on a $10,000 holding.
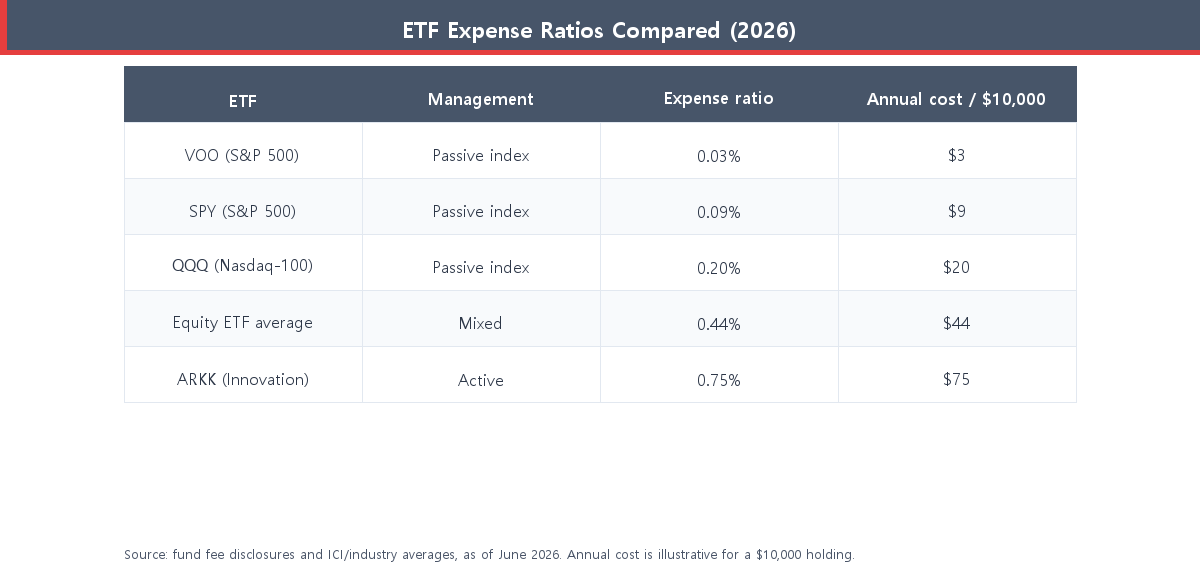
The pattern is clear: broad index ETFs such as VOO and SPY sit at the bottom of the range, while an actively managed fund like ARKK charges many times more. On a $10,000 holding, the gap between a 0.03% index ETF and a 0.75% active ETF is the difference between paying $3 and $75 every year — for funds that may even hold overlapping companies. If you are building a portfolio of several funds, our beginner’s guide to asset allocation shows how to combine low-cost ETFs without overpaying.
Why a 1% Fee Costs Far More Than It Looks
A 1% fee sounds harmless. The problem is compounding. Every dollar taken in fees is a dollar that stops growing for the rest of your investing life — and so is all the growth that dollar would have produced. Over decades, that lost compounding snowballs into a number that has almost nothing to do with the modest percentage you started with.
Consider a single $10,000 investment left to grow for 30 years at a 7% average annual return. The chart below compares two otherwise identical paths: one in a low-cost ETF charging 0.03%, the other in a fund charging 1.00%.
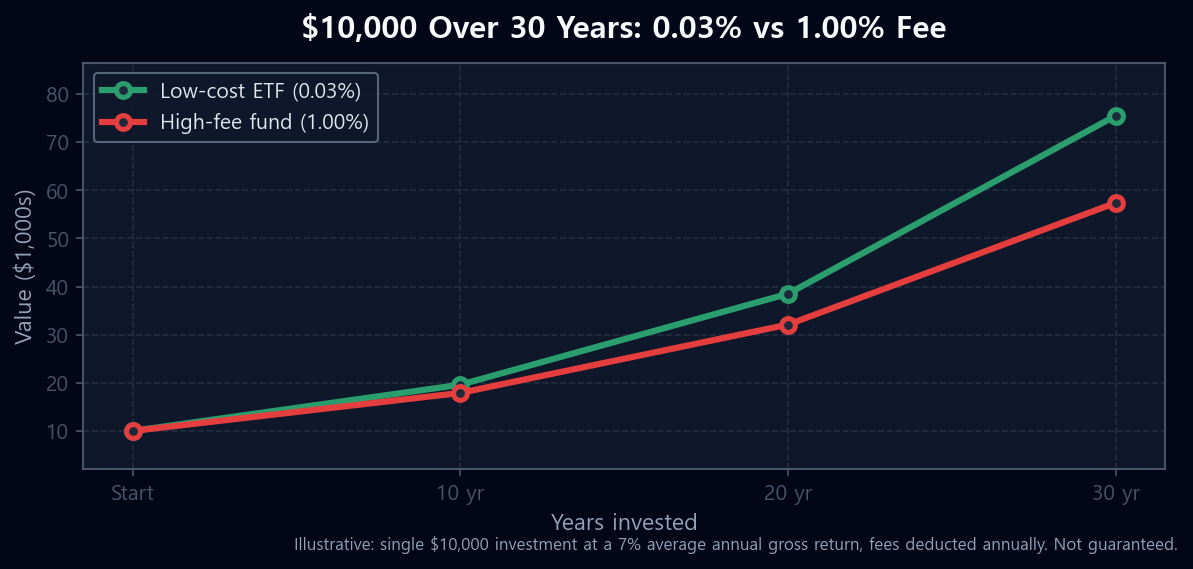
After 30 years, the low-cost ETF grows to roughly $75,500, while the 1% fund reaches only about $57,400 — a gap of more than $18,000 on the same $10,000 starting investment (illustrative, 7% annual return, not guaranteed). You contributed the same money and took the same market risk, yet nearly a quarter of your potential gain quietly disappeared into fees. The video below breaks down how expense ratios chip away at fund returns over time.
How to Stop Expense Ratios From Eating Your Returns
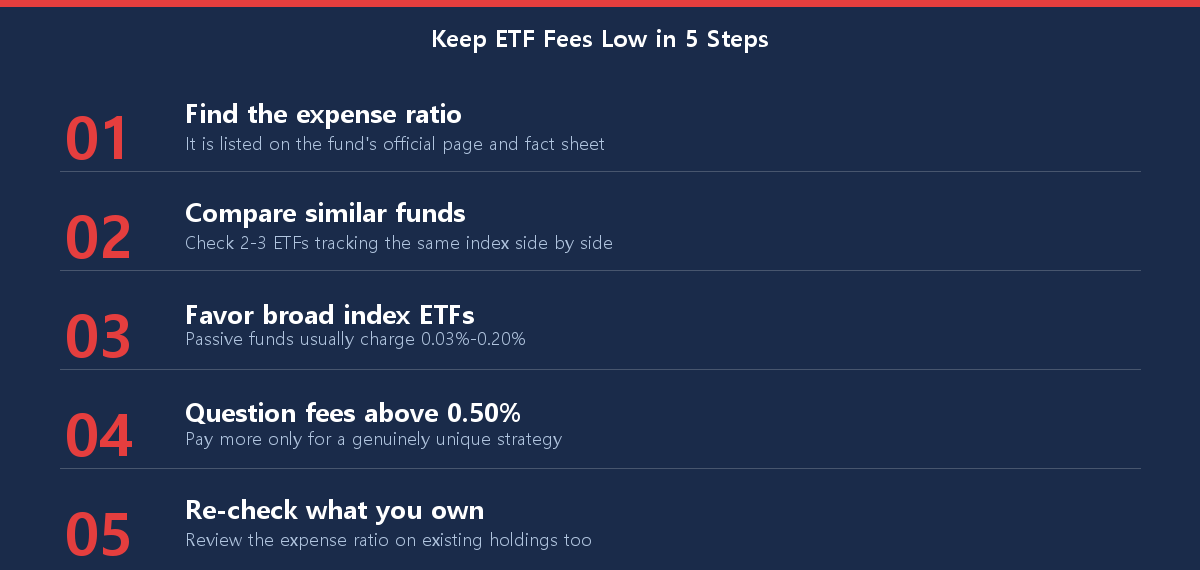
The good news is that controlling this cost is entirely within your power, and it takes only a few minutes per fund. The checklist below turns “watch your fees” into a concrete routine you can run before every purchase.
A Quick Rule of Thumb for “Good” vs “Expensive”
As a general benchmark for 2026, a broad index ETF charging 0.03%–0.10% is considered very cheap, anything up to roughly 0.25% is reasonable for a specialized or sector fund, and an expense ratio above 0.50% deserves a hard second look — especially when a near-identical low-cost alternative exists. Higher fees can occasionally be justified by a genuinely unique strategy, but the burden of proof is on the expensive fund. Even income-focused products differ widely on cost, which is why our roundup of the best high-yield dividend ETFs for 2026 lists each fund’s expense ratio alongside its yield.
Conclusion: Small Number, Big Difference
An ETF expense ratio is the quietest cost in investing: deducted daily, never billed, and already baked into the returns you see. That invisibility is exactly why it deserves your attention. The percentage looks trivial, but compounded across decades it can quietly eat a sizable share of your returns — as the 0.03% versus 1% comparison makes painfully clear. Before you buy any ETF, find the expense ratio, compare it against similar funds, and lean toward low-cost, broad index options whenever they fit your plan. If you are just getting started, our guide on how to start investing with only $100 walks through choosing your first low-fee fund.
Found this useful? Bookmark it, check the expense ratio on every ETF you already own, and come back as we add more practical, beginner-friendly investing breakdowns.
This article is for informational purposes only and is not investment advice. Do your own research.