
The US Treasury yield curve steepening in 2026 is no longer a footnote — it is the defining feature of the fixed income landscape. As of late July 2026, the 30-year Treasury yield sits at 5.13% while the 2-year note yields around 4.26%, a spread that has widened considerably from the inverted curve that dominated 2022–2024 (Source: U.S. Treasury / Advisor Perspectives, July 2026). For long-term bond investors, this shift carries concrete consequences: higher current income on newly issued long bonds, but significant duration risk if yields keep climbing. Understanding what is driving the steepening — and what to do about it — is one of the most important positioning decisions in bonds right now.

What Is a Yield Curve Steepening? Bull vs. Bear
The Treasury yield curve plots interest rates across all maturities, from the 3-month T-bill to the 30-year bond. When long-term rates rise relative to short-term rates — widening the gap between them — the curve steepens. This is the opposite of an inverted curve, where short-term rates sit above long-term ones.
Not all steepening is the same. The two main types move through very different mechanisms:
- Bull steepening: Short-term rates fall faster than long-term rates, usually as the Fed cuts in response to economic weakness. Bond prices generally rise across the curve, with the short end rallying the most.
- Bear steepening: Long-term rates rise faster than short-term rates, driven by inflation fears, rising term premium, or heavy Treasury supply. Long bond prices fall even as short-end yields hold steady or decline modestly.
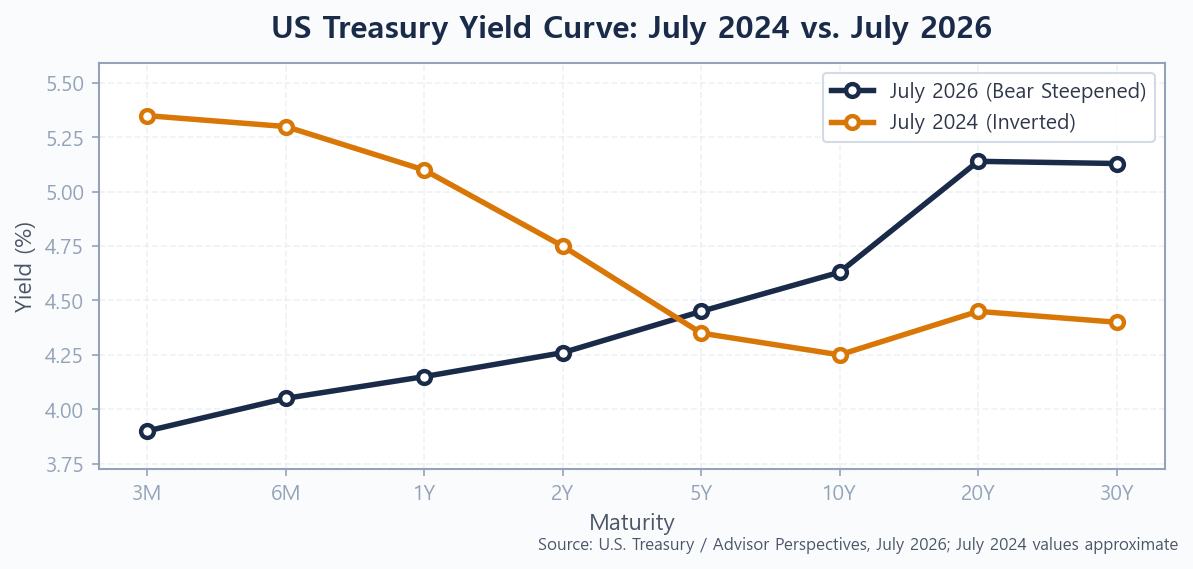
The 2026 steepening is predominantly a bear steepener. The Fed has eased slightly from its 2023–2024 peak but then paused, keeping the short end anchored. Meanwhile, the long end has surged — driven by structural forces well beyond monetary policy alone. The visual below illustrates just how dramatically the curve’s shape has shifted between mid-2024 and mid-2026.
Why Is the Yield Curve Steepening in 2026?
Three interlocking forces are pushing long-term Treasury yields higher while the short end remains relatively contained.
Rising Term Premium at the Long End
Investors who commit to a 20- or 30-year Treasury accept far more uncertainty than buyers of a 3-month T-bill. That uncertainty demands compensation — specifically, a term premium, the extra yield investors require for bearing duration risk. After years of near-zero or even negative term premium (a legacy of quantitative easing), the term premium on the 10-year Treasury has moved firmly back into positive territory in 2026. Market participants now price in the possibility that inflation could surprise again, that fiscal conditions could worsen, or that global investors might demand higher compensation to absorb US debt issuance at scale.
Fiscal Deficits and Treasury Supply
The US federal deficit has remained structurally wide, forcing the Treasury to issue record quantities of longer-dated notes and bonds. Simple supply-and-demand mechanics apply: more supply means issuers must offer higher yields to attract buyers. When the Congressional Budget Office projects trillion-dollar annual deficits for much of the decade ahead, the bond market prices a risk premium into long-duration paper. This supply-driven pressure falls disproportionately on 10-, 20-, and 30-year maturities — exactly the securities that bear the brunt of the steepening.
The Fed’s Pause at the Short End
After a rate-cutting cycle that began in late 2024, the Federal Reserve paused its easing in early 2026 as core inflation proved stickier than anticipated. That pause kept the 2-year yield — the most Fed-sensitive maturity — relatively elevated at around 4.26% as of July 2026. As a result, the curve has steepened from the top end of the maturity spectrum rather than the bottom. The spread between the 10-year (4.63%) and the 3-month (≈3.90%) has widened to roughly 73 basis points, while the 30-year now yields nearly 90 basis points above the 2-year. For context on where the Fed stands and what a higher-for-longer rate path means for portfolios, see Will the Fed Hike Rates in 2026? Higher for Longer.
The video below from December 2025 provides a useful framework for thinking about yield curve re-steepening and credit spreads heading into 2026 — directly relevant to the dynamics we are now experiencing.
How Steepening Hurts Long-Term Bond Investors
Most investors understand that bond prices move inversely with yields. What is less intuitive is how much more sensitive long-duration bonds are to yield changes compared to shorter maturities. In a bear steepening, this asymmetry becomes painfully clear: short-term bondholders are largely insulated while long-bond holders absorb serious price losses.
Duration Risk Amplified
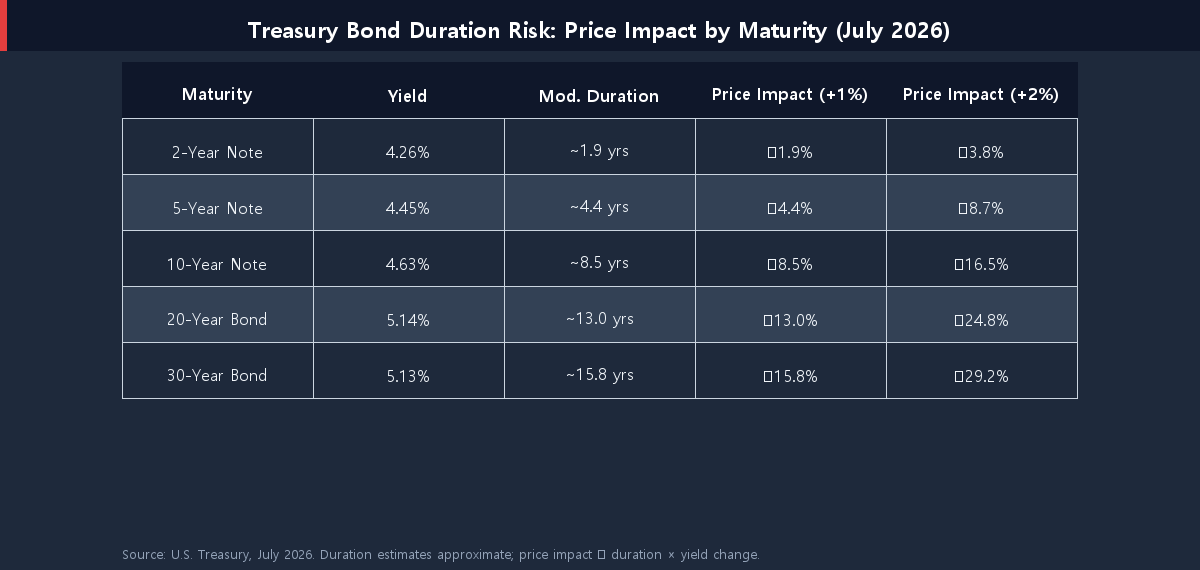
Modified duration — a bond’s price sensitivity per 1-percentage-point change in yield — grows dramatically with maturity. A 2-year Treasury has a modified duration of roughly 1.9 years, meaning a 1% yield increase costs about 1.9% in price. A 30-year bond, with a modified duration near 15.8 years, loses close to 16% of its market value for the same yield move. The table below puts current 2026 yields side by side with the price impact of further yield rises.
Price Losses on Existing Long Bonds
Investors who purchased 30-year Treasuries in 2020 or 2021 — when yields were below 2% — have already absorbed historic mark-to-market losses. Today’s long-bond buyers at 5.13% face a different entry point, but they are not immune. If the bear steepening continues and 30-year yields push toward 5.5–5.75%, even recently purchased 30-year bonds could shed another 6–9% in price. The current yield does not fully compensate for that risk on a risk-adjusted basis relative to the intermediate segment of the curve. For a data-driven view on where 10-year Treasury yields may go and what a 4%+ world implies for positioning, see 10-Year Treasury Yield Outlook 2026.
What Should Long-Term Bond Investors Do?
A bear steepening environment does not call for abandoning bonds — fixed income is still generating its strongest yields in over a decade. It does call for precision about where on the curve you take your exposure, and what complements bonds in your broader portfolio.
Favor Intermediate Maturities (4–10 Years)
Charles Schwab’s 2026 Fixed Income Mid-Year Outlook recommends investors favor intermediate-term maturities, generally in the 4- to 10-year maturity range, given the outlook for a steeper yield curve (Source: Schwab, July 2026). At the current 5-year yield of approximately 4.45%, investors capture compelling real returns with roughly one-third the duration risk of a 30-year bond. If long yields climb another 50–100 basis points, the intermediate zone absorbs far less price damage while still delivering attractive income. The case for this positioning is developed in full in Why Short-Duration Bonds Win in a 4% Treasury World (2026).
Consider a Bond Ladder
Rather than concentrating risk at a single maturity, a bond ladder staggers holdings across several maturities — for example, equal portions in 2-year, 5-year, 7-year, and 10-year Treasuries. As shorter-term rungs mature, proceeds are reinvested at whatever rates prevail at that time. If yields rise further, you capture higher rates at reinvestment. If they eventually fall, your longer rungs are locked into today’s attractive yields. A ladder also smooths price volatility because not all positions move together. A deeper comparison of a Treasury bond ladder versus bond ETFs — including a $100,000 ladder example at current yield levels — is in Treasury Bond Ladder vs. Bond ETF: Retirement Income 2026.
Look at TIPS for Inflation Protection
One significant driver of the bear steepening is lingering uncertainty about inflation — investors are not fully confident that the Fed has permanently tamed price pressures. Treasury Inflation-Protected Securities (TIPS) adjust their principal with CPI, protecting holders if inflation surprises to the upside — precisely the scenario that makes long nominal Treasuries risky right now. With real yields on 10-year TIPS hovering near 2.0% as of mid-2026, TIPS offer a meaningful real return while hedging the inflation tail risk embedded in the current steepening. If you are weighing TIPS against I Bonds for the inflation-protection sleeve of your portfolio, the full trade-off analysis is in TIPS vs. I Bonds: Best Inflation Protection for 2026.
If you hold corporate bonds alongside Treasuries, note that the same duration and term-premium dynamics affect investment-grade long-duration credit — and corporate bonds carry additional credit risk on top of rate risk. The spread analysis is covered in Corporate Bonds vs. Treasuries in 2026: Worth the Risk?
Conclusion: The Curve Has Spoken — Duration Has a Cost
The Treasury yield curve steepening in 2026 is a structural signal, not transient noise. Higher term premium, persistent fiscal deficits, record Treasury supply, and a Fed that is in no hurry to resume cutting have combined to lift long-term yields to levels that expose long-bond holders to meaningful price risk. The steepening rewards investors who position in the 4- to 10-year intermediate zone — capturing solid yields without absorbing outsized duration exposure — and punishes those who reach for the highest nominal yield at the long end without fully pricing in the risk.
The practical framework for long-term bond investors right now: favor 4- to 10-year Treasuries, use a bond ladder to manage reinvestment risk across rate scenarios, and deploy TIPS to hedge the inflation uncertainty that is partly fueling the steepening. If and when the 30-year yield rises to a genuinely compensatory level — say, above 5.5% on a sustained basis — that may mark a better entry point for longer duration. Until then, the intermediate part of the Treasury yield curve offers the most defensible risk-adjusted value in US fixed income.
Found this useful? Bookmark it so you can revisit when the market moves.
This article is for informational purposes only and is not investment advice. Do your own research before making any investment decisions.