
Emerging market bonds are having a moment. The US dollar has shed roughly 10% from its 2025 peak, the Federal Reserve has stepped back from hiking rates, and the iShares J.P. Morgan USD Emerging Markets Bond ETF — ticker EMB — now yields 6.57% on a 30-day SEC basis (Source: iShares, as of October 20, 2026). That is a full 123 basis points above the 10-year US Treasury yield. For income-focused investors watching their savings accounts shrink in real terms, that spread is hard to ignore.
But a fat yield in emerging markets debt rarely comes free. Sovereign defaults, currency swings, and longer-duration sensitivity can bite hard precisely when equity markets are also falling. This guide breaks down what EMB actually holds, why the macro backdrop matters so much right now, how it compares with its closest alternatives, and what realistic position sizing looks like for a diversified portfolio.

What Is the iShares EMB ETF — and Who Is It For?
EMB tracks the J.P. Morgan EMBI Global Core Index, a benchmark of US dollar-denominated sovereign and quasi-sovereign bonds issued by emerging-market governments. Because the bonds are denominated in dollars, you are not taking on the local currency risk that comes with, say, a Brazilian real bond. The currency risk you do carry is your home currency versus the US dollar — which, as we will see, is actually relevant right now.
The fund manages roughly $13 billion in assets, holds 618 securities, and charges an expense ratio of 0.39% (Source: iShares, October 2026). It pays distributions monthly, which makes it popular with retirees and income investors who want regular cash flow without rebalancing individual positions.
What EMB Actually Holds
The largest country exposures include Mexico, Brazil, Indonesia, Saudi Arabia, Turkey, and a handful of smaller emerging economies. That geographic diversity sounds reassuring, but it also means the index includes countries with very different fiscal profiles. Mexico and Saudi Arabia are investment-grade issuers with deep bond markets. Turkey and Argentina are a different story — both have restructured debt within recent memory.
The weighted average maturity sits at 10.45 years and the weighted average yield to maturity is 7.12% (Source: iShares, October 2026). That long duration means that a 1% rise in underlying yields would shave roughly 8–10 points off NAV — a meaningful price risk if the macro narrative shifts.
How EMB Pays You (and How Stable That Income Is)
EMB’s current 30-day SEC yield is 6.57%, with a 12-month trailing distribution yield of 5.41%. Monthly distributions have ranged from $0.38 to $0.42 per share in 2026 — that variability is worth noting. The May 2026 payout fell to $0.4101 from $0.4554 in April, a drop of nearly 10% month-over-month (Source: iShares, May 2026).
The distributions are not a fixed coupon; they reflect the coupons on the underlying bonds minus the fund’s operating costs. When bonds mature or default, the reinvestment yield can differ. Income seekers should model a range of scenarios rather than projecting the current yield in a straight line.
The Macro Case for EM Bonds in Q4 2026
Three macro forces have aligned to make emerging market bonds more attractive in the second half of 2026 than they were in 2024 or early 2025. Understanding each one — and why they are not permanent — is essential before deciding on an allocation.
Dollar Weakness: The Single Biggest Tailwind
The US dollar posted its steepest annual decline in eight years in 2025 and has continued to soften into 2026. For EM bonds, this matters for a straightforward reason: most EM borrowers hold dollar-denominated debt. When the dollar weakens, the real debt burden for these governments falls in local-currency terms, reducing default risk and making the bonds more attractive to international capital. Simultaneously, non-US investors who hold EMB see a currency lift when they convert returns back to euros, yen, or Australian dollars.
Dollar weakness tends to trigger capital flows toward EM assets. Historically, the correlation between a weaker DXY and EM bond inflows is positive and fairly consistent. That said, the dollar cycle can reverse quickly — and when it does, EM bonds tend to sell off hard alongside other risk assets. For a fuller picture of how the dollar’s direction ripples through your portfolio, see my post on how a weakening dollar affects your whole portfolio.
Fed Pausing Rate Hikes — What It Means for EM Debt
Emerging market central banks spent much of 2022–2024 hiking aggressively to defend their currencies and anchor inflation — often ahead of the Fed. Now that the Fed has paused its hiking cycle and markets are pricing in gradual cuts, the interest-rate differential between EM and developed-market debt remains wide even as EM headline yields have fallen from their peaks. That spread is the “carry” that attracts global bond investors.
A Fed that is on hold or cutting is also a Fed that is not draining global dollar liquidity. Tighter dollar liquidity has historically been the single most dangerous environment for EM debt — it was the proximate cause of the 1997 Asian financial crisis and the 2018 EM selloff. With the Fed stepping back, that tail risk shrinks — though it does not disappear. You can read a detailed breakdown of the Fed’s current signaling and what the dot plot implies for the year ahead in Will the Fed cut rates in 2026?
EM Real Yields Still Beat Developed Markets
Beyond the dollar narrative, the fundamental carry case for EM bonds remains intact. Real yields — nominal yield minus inflation — in major EM economies still run significantly higher than in the US, eurozone, or Japan. Countries like Brazil, Mexico, and Indonesia have kept policy rates elevated even as their inflation has retreated, creating positive real yields of 3–6%. That structural carry is what gives EM bonds their long-run return premium over developed-market fixed income.
The CNBC clip above features a Neuberger Berman portfolio manager walking through exactly why institutional capital has been rotating into EM debt ETFs in 2026 — the dollar dynamic and carry argument are both covered in under five minutes.
EMB vs. VWOB vs. EMLC: Choosing the Right EM Bond ETF
EMB is the largest and best-known EM bond ETF, but it is not the only option. Two close competitors — Vanguard’s VWOB and VanEck’s EMLC — offer meaningful differences in cost, composition, and risk profile.
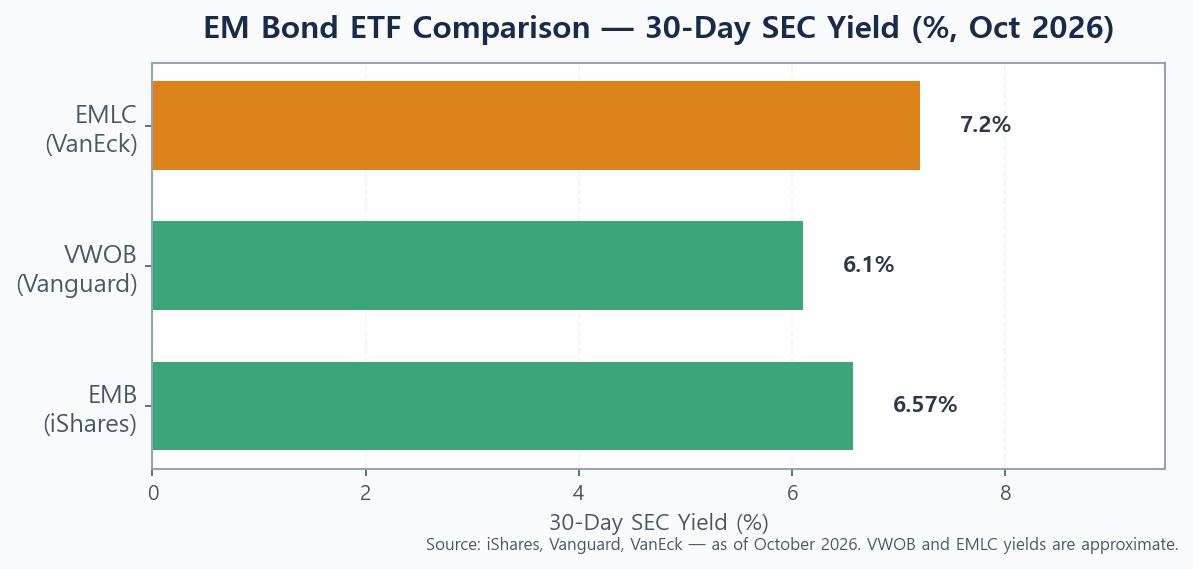
At first glance, EMLC’s ~7.2% yield looks more attractive than EMB’s 6.57%. But that extra yield comes from a fundamentally different source of risk — and one that is even more sensitive to the dollar’s direction.
Hard Currency vs. Local Currency — Which Is Safer?
EMB and VWOB hold US dollar-denominated bonds. EMLC holds bonds denominated in local currencies — Brazilian reals, Indonesian rupiah, Mexican pesos, and so on. When the dollar weakens, local-currency bonds deliver a double benefit: the coupon paid in local currency is worth more in dollar terms, and rising EM currencies push up NAV. That explains EMLC’s outperformance in dollar-weakness cycles.
The risk is the mirror image. When the dollar strengthens — as it did sharply in 2022 — local-currency EM bonds can lose 20–30% in dollar terms even if the underlying credit quality is fine. EMLC is, in effect, a bet on both EM sovereign creditworthiness and a sustained weak dollar. If only one of those conditions holds, the ETF can disappoint significantly.
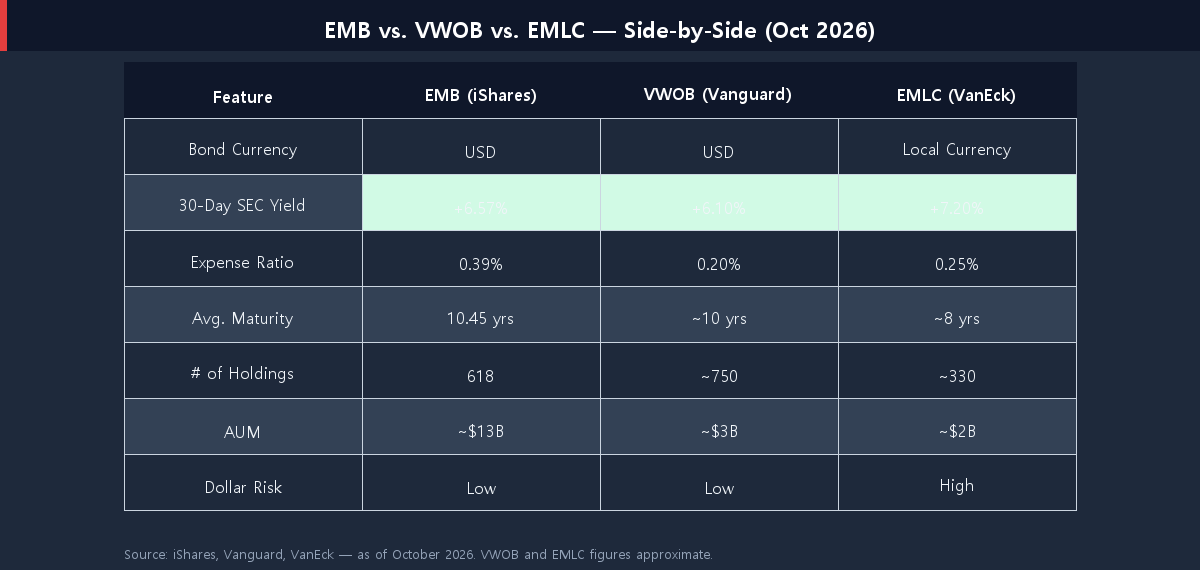
VWOB (Vanguard Emerging Markets Government Bond ETF) sits closest to EMB in structure — also USD-denominated — but charges just 0.20% vs. EMB’s 0.39%. Its yield runs slightly lower (~6.1%) because Vanguard’s index tilts toward investment-grade sovereign debt and excludes some of the higher-yielding but riskier quasi-sovereign names. For investors who prioritize cost efficiency over maximum yield, VWOB merits serious consideration as an EMB substitute.
If you are trying to decide between higher-yield EM debt and the safer end of the fixed-income spectrum, my comparison of corporate bonds vs. Treasuries in 2026 offers a useful framework for thinking about the risk–reward tradeoff at different credit tiers.
The Risks Hiding Behind a 6.57% Yield
No discussion of EMB is complete without an honest look at what can go wrong. The yield premium exists precisely because EM sovereign bonds carry risks that US Treasuries and investment-grade corporate bonds do not. Here are the three that deserve the most weight in Q4 2026.
Sovereign Default Risk: When Countries Stop Paying
EMB has held bonds from Argentina, Venezuela, Sri Lanka, and Russia — all of which defaulted or underwent debt restructuring during the fund’s lifetime. When a sovereign defaults, a restructuring typically involves maturity extensions, coupon cuts, or a haircut on principal. The fund writes down the position, NAV drops, and the income stream from those bonds disappears until restructuring concludes.
This risk is partially mitigated by diversification across 618 securities and 80+ countries. A single country default rarely destroys more than 1–2% of the portfolio. But during a systemic EM stress episode — where multiple countries face simultaneous pressure — defaults can cluster, and the selloff in other holdings can amplify the loss well beyond the defaulted positions alone. During the 2020 Covid shock, EMB fell roughly 18% peak-to-trough before recovering.
Duration Risk: 10+ Years of Interest Rate Sensitivity
With a weighted average maturity of 10.45 years, EMB carries significant duration risk. If EM sovereign yields rise by 1 percentage point — whether driven by a stronger dollar, a Fed pivot back to hikes, or country-specific fiscal stress — NAV falls by roughly 8–10 percentage points. That is comparable to a long-duration Treasury ETF like TLT. Investors who are attracted to EMB for its yield need to be comfortable holding through those mark-to-market drawdowns.
For context: as of October 20, 2026, EMB’s NAV was $91.11 with a year-to-date return of -1.53% (Source: iShares, October 2026). The fund’s 30-day SEC yield has moved higher even as the price has drifted down, which is the classic pattern when duration risk is materializing in the background.
If you would like to understand the broader interest-rate environment underpinning these yield levels, the 10-year Treasury yield outlook for 2026 provides the benchmark context.
Correlation Risk: EM Bonds Can Sell Off With Stocks
One reason investors hold bonds is to offset equity volatility. US Treasuries historically provide a reliable flight-to-safety bid during equity selloffs. EM bonds do not reliably do this. When global risk appetite deteriorates — equity markets drop, credit spreads widen — EM bonds often sell off alongside stocks. The diversification benefit is lower than many investors assume, and can vanish precisely when it is most needed.
This is the core tension in EMB: it offers equity-like risk during stress, but fixed-income-like yield during calm periods. Whether that tradeoff works for you depends heavily on your overall portfolio construction and your time horizon. Investors who want a safer fixed-income anchor for their portfolio should also review how to buy US Treasury bonds as a direct comparison on the risk spectrum.
How Much EMB Should You Hold in a Diversified Portfolio?
The academic literature on EM debt as a portfolio building block generally supports a modest allocation — typically in the 3–10% range for a diversified global bond sleeve. The rationale is that the carry premium is real and persistent over long periods, but the volatility and correlation with equities mean that over-weighting EM bonds can undermine the stabilizing function of a fixed-income allocation.
In practical terms, a portfolio with a 20–30% allocation to fixed income might carve out 3–5 percentage points (i.e., 10–20% of the bond allocation) for EM debt exposure. This captures the carry premium without letting a single EM stress episode dramatically alter overall portfolio outcomes.
For investors who currently hold zero EM bond exposure and are curious about adding it, the current macro environment — soft dollar, Fed on pause, EM fundamentals stable — represents one of the better entry windows in several years. But entry timing matters less than sizing. A position that is small enough to hold through a 20% NAV drawdown is a position you are likely to actually keep.
Bottom Line: Is EMB Worth Buying in Q4 2026?
The case for adding emerging market bond exposure in Q4 2026 is genuinely compelling: the dollar tailwind is intact, the Fed’s rate-hiking cycle is over, EM real yields remain wide, and EMB’s 6.57% SEC yield delivers a meaningful premium over both Treasuries and investment-grade corporate bonds. For income-focused investors with a time horizon of three years or more, the carry math works in your favor under the most likely scenarios.
The case for caution is equally real. Duration of 10+ years means sizable mark-to-market swings when yields move. Sovereign default risk is a permanent feature of the asset class, not an edge case. And when global markets panic, EM bonds tend to sell off alongside stocks — reducing their effectiveness as a portfolio cushion at the worst possible time.
A modest allocation — 3–5% of total portfolio, sized so you can absorb a 20% drawdown without being forced to sell — looks reasonable in the current environment. Concentrating more than 10% of a diversified portfolio in EMB would require a very high conviction view on both the dollar and EM sovereign fundamentals holding up simultaneously. For most investors, that is more macro certainty than the market is offering right now.
Found this useful? Bookmark it so you can revisit when the market moves. I publish practical investing breakdowns regularly — check back soon.
This article is for informational purposes only and is not investment advice. Do your own research before making any investment decision.