
Three of the largest companies on Earth report earnings within 24 hours of each other — Microsoft and Alphabet after the close on October 28, 2026, and Amazon on October 29. Together they account for a substantial slice of almost every broad-market index and many growth ETFs. Before the Q3 2026 big tech earnings season puts those weights to the test, it is worth thinking clearly about what you own, why markets are so focused on AI capital spending, and what concrete steps can reduce unnecessary risk without abandoning long-term positions.

What’s at Stake This Earnings Season
This is not a typical earnings week. The central question is whether the hundreds of billions of dollars being poured into artificial intelligence infrastructure are beginning to generate revenue that justifies the cost. Hyperscalers — Microsoft, Alphabet, Amazon, and Meta — have collectively guided toward roughly $600 to $730 billion in capital expenditure during 2026 alone, against a combined revenue backlog of approximately $1.7 trillion (Source: company guidance, as of October 2026). Investors are no longer judging ambition; they are demanding visible payback in the form of cloud margin expansion and accelerating AI product revenue.
Stock reactions after earnings are notoriously difficult to predict. A beat on revenue with softer-than-expected cloud margins can push a stock lower. A miss on profit with bullish capex guidance can push it higher. The setup is volatile, and that volatility flows directly into every portfolio that owns QQQ, VOO, or any S&P 500 fund — whether investors realize it or not.
Key Numbers to Watch: Microsoft, Alphabet, and Amazon
Understanding what the market expects is half the battle. The table below summarizes the consensus estimates heading into earnings week, along with the cloud metrics that will drive the narrative.
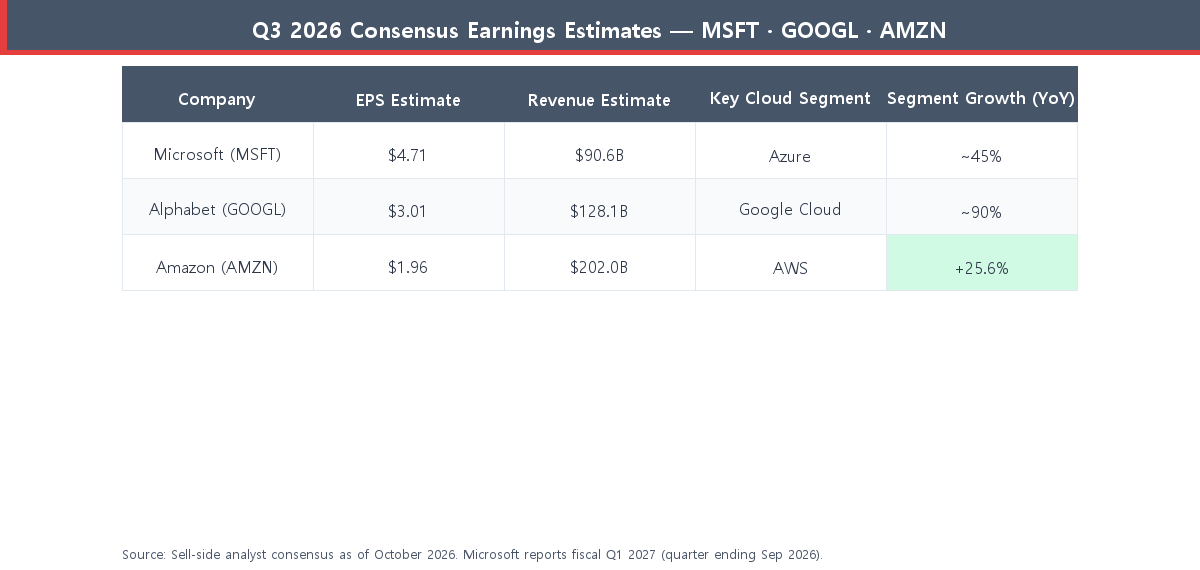
The following breakdown covers what each company’s cloud and AI metrics looked like heading into the reports — useful context whether you are watching results in real time or reviewing them after the fact.
Microsoft — Azure Growth and the AI Revenue Payoff
Microsoft is reporting its fiscal first quarter of 2027 (the quarter ending September 2026). Analyst consensus sits at $4.71 EPS on $90.63 billion in revenue. The single most-watched number is Azure growth: Microsoft’s own guidance points to approximately 45% growth in constant currency. More significant is what Microsoft has already disclosed — its AI business crossed a $37 billion annual revenue run rate in the most recent quarter, up 123% year-over-year (Source: Microsoft earnings commentary, 2026). Any indication that Azure growth is accelerating or that AI attach rates on enterprise products are rising would likely send the stock higher. Capex guidance above $50 billion for the year will be scrutinized alongside those revenue numbers to assess return on investment.
Alphabet — Cloud Acceleration and Search Defense
Alphabet reports its third quarter of 2026 with consensus at $3.01 EPS and $128.1 billion in revenue, implying roughly 25% year-over-year growth. Google Cloud has been the standout segment, with the market expecting approximately 90% growth from the prior year (Source: sell-side consensus, as of October 2026). Alphabet’s full-year capex range of $195 to $205 billion is the largest of the three companies in absolute terms. Investors will want to see cloud margins hold or expand while Search revenue demonstrates resilience against AI-native query tools. A weaker Search showing alongside surging cloud investment could raise concentration concerns for portfolio holders.
Amazon — AWS Momentum and Operating Margin Expansion
Amazon’s third quarter consensus is $1.96 EPS on $202 billion in revenue, +12% year-over-year. The key segment is AWS, where analysts expect $36.8 billion in revenue, a 25.6% year-over-year increase (Source: analyst consensus, as of October 2026). Amazon’s operating income is the metric that separates a strong result from a disappointing one — the company has spent years rebuilding margins after the 2022–2023 cost cycle, and any sign of compression from AI infrastructure spending would concern investors who have been rewarding the stock for margin recovery.
The $600 Billion AI Capex Test: What It Means for Stocks
Spending at this scale is unprecedented in corporate history. The four major hyperscalers are on track to spend more on infrastructure in 2026 than the entire U.S. defense budget in 2020. This creates a two-sided dynamic for investors.
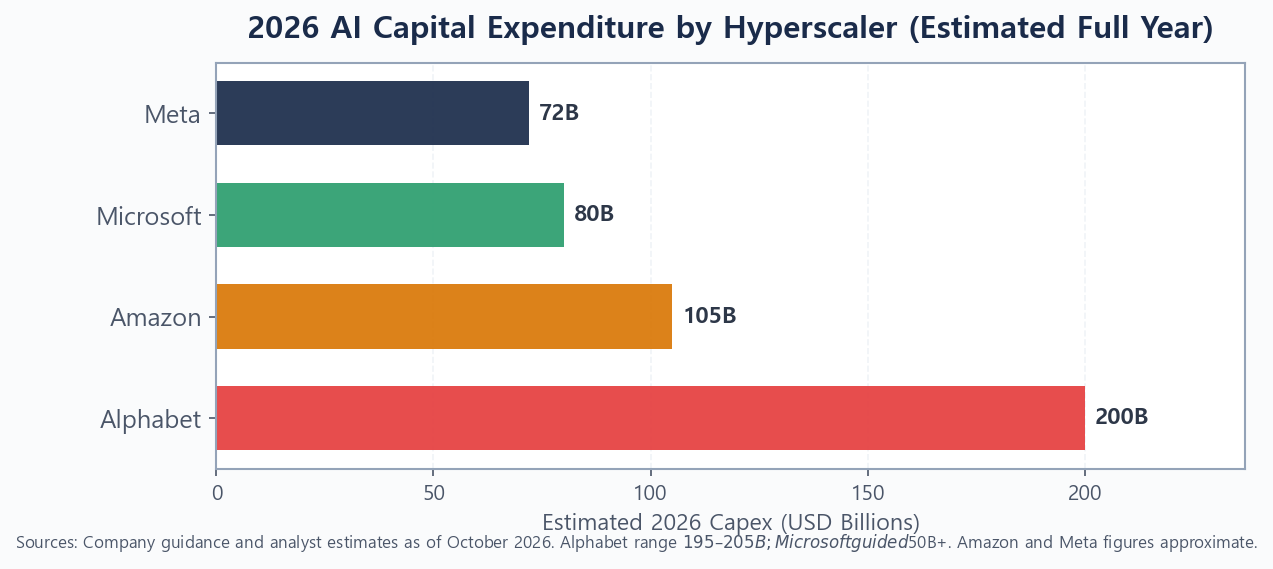
On the upside, heavy investment historically precedes periods of strong revenue growth in cloud and software. On the downside, if AI-driven revenue growth does not outpace capex growth at the operating income level, the market will punish elevated valuations quickly. Free cash flow generation — not just revenue — will be what sophisticated analysts watch most closely this earnings cycle. For portfolio holders, the practical implication is that a disappointing result from any one of these three companies can create a broad-market pullback, not just a single-stock decline.
If you want to think through how to reduce your exposure to a potential AI valuation correction more broadly, How to protect your portfolio from an AI bubble covers the key levers in detail.
4 Portfolio Strategies Before the Reports Drop
The goal here is not to predict the outcome — it is to ensure the outcome, whatever it is, does not force a decision you did not plan for.
1. Audit Your Magnificent Seven Concentration
Most investors underestimate how much big-tech exposure they carry through index funds. VOO (S&P 500) has roughly a third of its weight in the Magnificent Seven. QQQ is even more concentrated. Before earnings week, pull up your brokerage’s portfolio breakdown and calculate what percentage of your total investable assets sits in Microsoft, Alphabet, and Amazon — directly or through funds. A widely-cited rule of thumb is that a single company should not exceed 5% of your total portfolio. If Microsoft, Alphabet, or Amazon individually exceed that threshold, consider whether it is intentional or accidental.
For a deeper look at how equal-weighting can reduce this kind of concentration risk, see Equal-weight vs market-cap ETF in 2026.
2. Don’t Add to Single-Stock Positions Before the Report
Earnings weeks reward patience. Even when you have high conviction in a company’s long-term trajectory, adding to a position in the days immediately before a major earnings report increases your exposure to overnight gaps in either direction. Post-earnings volatility can run 5% to 10% or more in a single session for mega-cap tech names. If you believe in the long-term thesis, you are likely to find a better entry after the report rather than before it — either because the stock sells off and gives you a lower cost basis, or because a strong beat is confirmed and you can size in with higher confidence. For the mechanics of why lump-sum entries near catalysts can be suboptimal, Dollar-cost averaging vs lump-sum investing is worth reviewing.
3. Use Dollar-Cost Averaging Through Earnings Volatility
If you have capital to deploy and a regular investment plan, earnings weeks are not a reason to stop — they are a reason to stay disciplined. Dollar-cost averaging means that a post-earnings dip automatically gives you more shares for the same dollar amount. The key is not to pause contributions out of fear and then pile in after a strong reaction — that pattern tends to produce higher average costs, not lower ones. Stick to the schedule you set before earnings season began.
4. Keep a Cash Reserve for Post-Earnings Entries
If you are underweight big tech and have been waiting for a better entry, earnings week is one of the few times each year when a meaningful dip can appear quickly on quality names. Holding a modest cash reserve — 5% to 10% of your equity allocation — gives you the flexibility to act without panic-selling something else to fund it. This is distinct from market timing; it is simply keeping dry powder for a planned opportunity rather than being 100% invested with no flexibility.
If you are looking for a diversified way to build tech exposure beyond individual stocks, Best AI-themed ETFs for 2026: QQQ vs SOXX vs BOTZ lays out the tradeoffs.
What Happens If Big Tech Disappoints?
A broad disappointing result from Microsoft, Alphabet, and Amazon in the same week would likely trigger a risk-off reaction across indices. The S&P 500 and Nasdaq would probably fall, bond prices could rise as investors seek safety, and growth stocks outside big tech would face collateral selling pressure. The historical pattern after earnings-driven tech selloffs is that recoveries take between one and six months, depending on whether the miss reflects a macro shift or a company-specific execution issue.
What to avoid in that scenario: panic-selling diversified index fund positions in response to a single bad earnings week. What to consider: if cash reserves allow, looking at whether the selloff is pricing in a structural problem or a temporary one. Individual stock decisions — particularly around AI chip suppliers like NVIDIA and TSMC — often follow big tech reactions with a lag, which can create secondary positioning opportunities.
For investors who want a resilient foundation regardless of how earnings land, How to build a simple 3-fund portfolio in 2026 is a useful starting point.
Frequently Asked Questions
Should I sell before earnings to avoid the volatility?
Selling before earnings locks in gains or losses and forces a decision about when to buy back. For long-term investors in diversified funds, staying put is generally more efficient than trying to exit and re-enter around a specific event. For concentrated single-stock holders, a partial trim to reduce position size to a planned level can make sense — but the motivation should be risk management, not prediction.
Do these earnings results affect bond or gold prices?
They can. A broad tech selloff often triggers a flight to safety that pushes Treasury yields lower (prices higher) and gold up slightly. The effect tends to be short-lived unless earnings reveal a macro signal — like enterprise software demand falling — that implies broader economic slowing.
Is Microsoft reporting Q3 or Q4 2026?
Microsoft’s fiscal year ends in June. The quarter ending September 2026 is its fiscal Q1 of 2027, which is why some sources refer to it as “fiscal Q1 2027” while others call it “Q3 calendar 2026.” The numbers referenced in this article are for the September 2026 quarter.
What if I don’t hold any of these stocks directly?
If you own a broad-market index ETF like VOO, VTI, or QQQ, you almost certainly have indirect exposure to Microsoft, Alphabet, and Amazon. Their combined weight in VOO is roughly 11% as of late 2026. An earnings shock large enough to move those stocks 5% would move the S&P 500 by roughly 0.5%, all else equal.
Worth reading next:
Best AI-themed ETFs for 2026: QQQ vs SOXX vs BOTZ vs individual stocks
Equal-weight vs market-cap ETF in 2026: is it time to ditch VOO for RSP?
This article is for informational purposes only and is not investment advice. Do your own research.