
You’ve decided to invest in the S&P 500. Good move — decades of data back it up. But then you open your brokerage and see four nearly identical tickers: SPY, IVV, VOO, and SPLG. Same 503 companies, same market-cap weighting, essentially the same return on any given day. So why does the choice even matter? Because over 30 years, picking the wrong one can silently cost you more than $30,000 on a $100,000 investment — without a single bad stock pick. This guide breaks down the real differences and tells you exactly which S&P 500 ETF fits your situation in 2026.

They All Track the Same Index — So Why Does the Choice Matter?
SPY, IVV, VOO, and SPLG all hold approximately 503 U.S. large-cap stocks weighted by market capitalization. Their top five holdings are identical: NVIDIA, Apple, Microsoft, Amazon, and Alphabet. On any given trading day, their price movements are virtually indistinguishable.
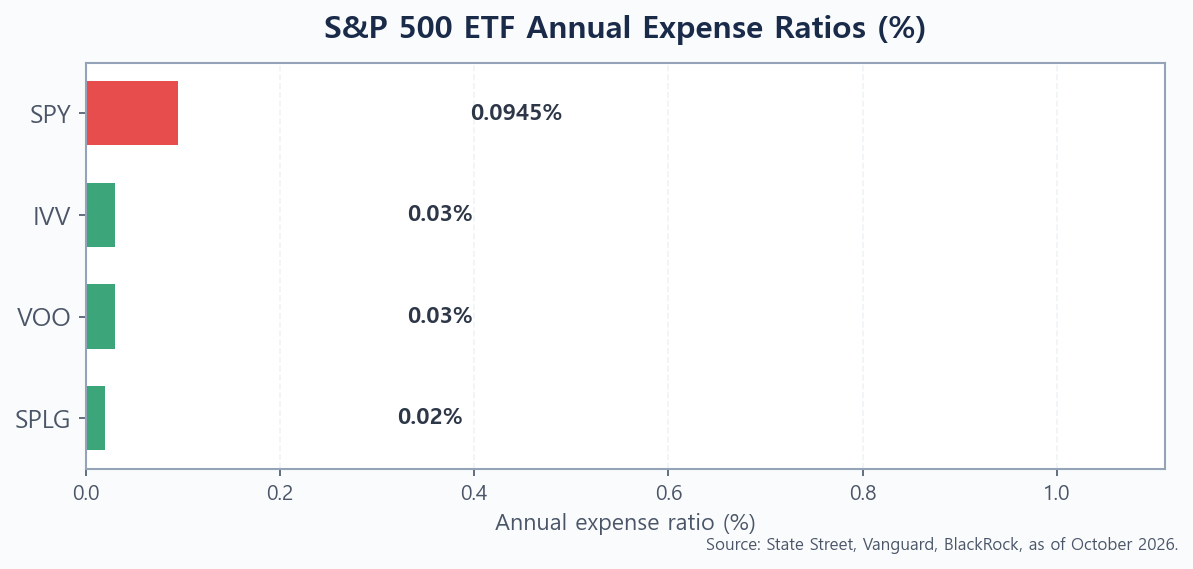
The differences that do exist fall into three categories: fees, fund structure, and liquidity. None of those show up in the returns on a single day. But compounded over years, they add up to real money. The fee gap between SPY (0.0945%) and VOO/IVV (0.03%) is 0.06 percentage points per year — small enough to ignore in January, large enough to fund a vacation by year 10, and large enough to buy a car by year 30.
One more note before the numbers: State Street renamed SPLG to SPYM in 2026. The index, expense ratio, and fund structure remain unchanged — it’s the same product with a new ticker. This article uses “SPLG” throughout because that’s still the dominant search term, but if you see SPYM in your brokerage, they are the same ETF.
Key Specs at a Glance: Expense Ratio, AUM, and Liquidity
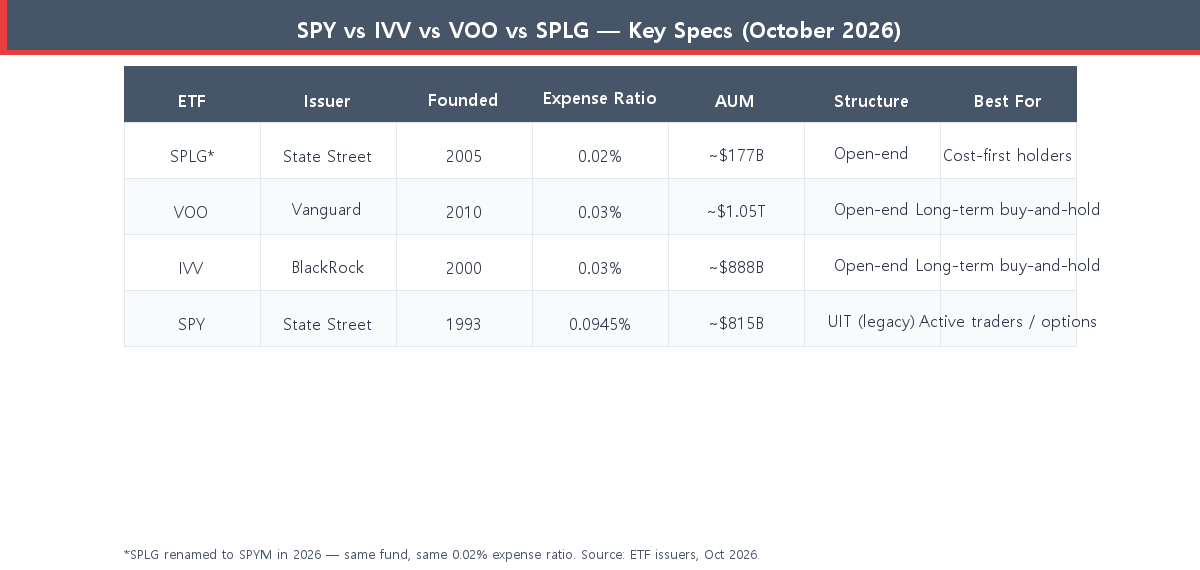
Here are the numbers that actually matter for a long-term investor (Source: ETF issuers, as of October 2026):
- SPLG (SPYM) — State Street | Founded 2005 | Expense ratio: 0.02% | AUM: ~$177B | Open-end fund
- VOO — Vanguard | Founded 2010 | Expense ratio: 0.03% | AUM: ~$1.05T | Open-end fund
- IVV — BlackRock (iShares) | Founded 2000 | Expense ratio: 0.03% | AUM: ~$888B | Open-end fund
- SPY — State Street (SSGA) | Founded 1993 | Expense ratio: 0.0945% | AUM: ~$815B | Unit Investment Trust (UIT)
VOO recently crossed $1 trillion in AUM — the first ETF in history to do so. IVV and SPY follow closely. SPLG, despite having the lowest expense ratio, remains a fraction of the size, largely because it lacks the options market depth that traders require from SPY.
Why SPY Costs Three Times More Than VOO or IVV
SPY was the first U.S. ETF, launched in January 1993 — a genuine pioneer. Its fee of 0.0945% was competitive in 1993. It is not in 2026. VOO and IVV both charge 0.03%, and SPLG charges just 0.02%. So why hasn’t SPY cut its fee?
SPY’s massive liquidity and deep options ecosystem have made it the default instrument for institutional traders and hedge funds — and those users are largely insensitive to a few extra basis points. State Street keeps the fee because it can. For a long-term buy-and-hold investor, however, there is no performance advantage to owning SPY over VOO or IVV. You’re paying more for liquidity you’ll never use.
If the expense ratio discussion is new to you, it’s worth understanding how this annual fee quietly reduces your balance. My deep-dive on ETF expense ratios walks through the mechanics with real numbers.
SPLG (Now SPYM): The Cheapest Option Most Investors Overlook
At 0.02%, SPLG costs less than VOO or IVV. On a $1,000,000 portfolio, that 0.01% difference saves $100 per year — modest, but real. The bigger drawback is liquidity: SPLG trades roughly 5–6 million shares per day, compared to VOO’s 6–7 million and SPY’s staggering ~70 million. For a retail investor placing a $10,000 limit order, this doesn’t matter. For anyone making large trades or using options strategies, it matters a great deal.
SPLG/SPYM is a legitimate choice for disciplined buy-and-hold investors who want to squeeze every basis point of return. Just be aware that it has far less brand recognition, which means slightly less liquidity and a thinner options market — neither of which affects a patient, long-term holder.
Structure Matters More Than You Think: UIT vs. Open-End Fund
This is the most overlooked difference between SPY and the other three. SPY is structured as a Unit Investment Trust (UIT), a legacy legal form from its 1993 launch. VOO, IVV, and SPLG are all open-end funds — the modern ETF structure.
What does this mean in practice?
- Dividend reinvestment: Open-end funds (VOO, IVV, SPLG) can temporarily invest incoming dividends in the underlying holdings before distributing them at quarter-end. This eliminates “dividend drag” — the cash that sits idle in a UIT between the ex-dividend date and the distribution date. In a rising market, that idle cash slightly underperforms.
- Securities lending: Open-end funds can lend their holdings to short sellers and collect interest, which can fractionally offset fees. UITs generally cannot.
- Flexibility: Open-end funds can hold derivatives and manage cash more efficiently. For a passive index ETF this rarely matters, but it gives fund managers small optimization tools.
In dollar terms, the UIT disadvantage is small — likely 0.02–0.04% per year in most market conditions. But it consistently nudges VOO’s and IVV’s tracking error below SPY’s, and for a 30-year holder, every fraction of a percent counts.
The 30-Year Cost Simulation: How Small Fees Compound Against You
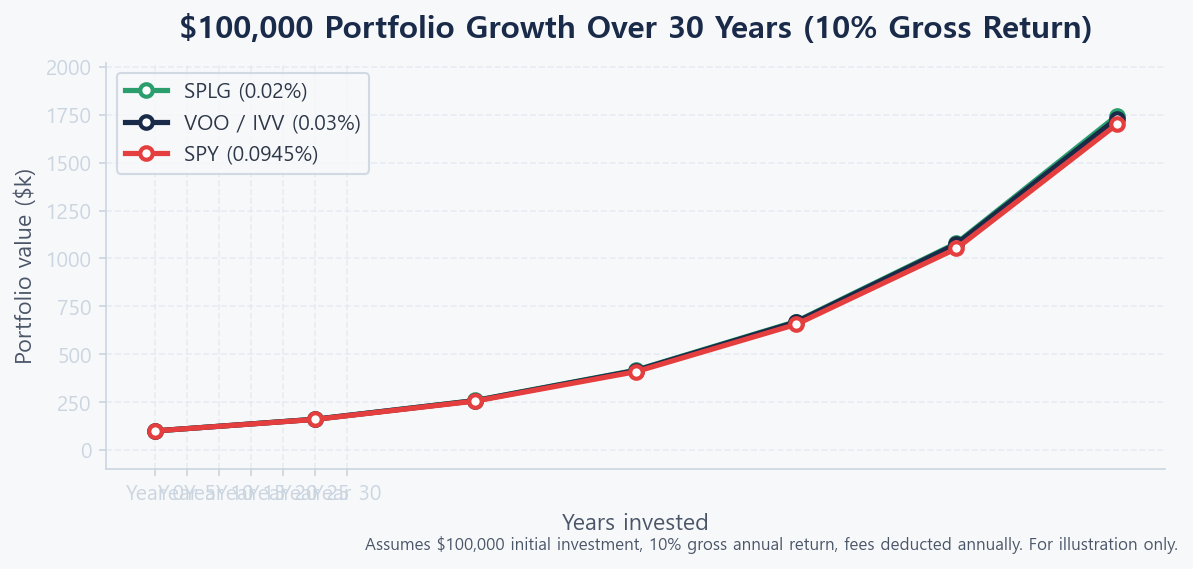
Assume you invest $100,000 today across all four ETFs, with an identical 10% gross annual return from the index. Here’s what the fee gap alone does to your ending balance over 30 years:
- SPLG (0.02% fee, 9.98% net): ~$1,745,000
- VOO / IVV (0.03% fee, 9.97% net): ~$1,730,000
- SPY (0.0945% fee, 9.9055% net): ~$1,700,000
The SPY holder ends up with approximately $30,000–$45,000 less than the VOO or IVV holder, despite buying the exact same 503 stocks. The SPLG holder edges out VOO/IVV by another ~$15,000. No market timing required — the difference is purely fee drag compounding over time.
This is why the personal finance community often calls SPY “the trading ETF” and VOO/IVV “the investing ETF.” Both descriptions are fair.
The video below illustrates exactly how this fee math unfolds and why most long-term investors end up holding the wrong S&P 500 ETF without realizing it.
Which S&P 500 ETF Is Best for Your Investor Profile?
Long-Term Buy-and-Hold Investors
VOO or IVV. Both charge 0.03%, carry the open-end structure, and have ample liquidity for retail-sized orders. The only practical question is which broker you use: Vanguard clients often find VOO the natural default; Fidelity and Schwab clients tend toward IVV because of tight integrations and commission structures. Performance over the past decade has been statistically identical.
If you’re building a simple 3-fund portfolio, either VOO or IVV works perfectly as the U.S. equity core.
Active Traders and Options Investors
SPY — and it’s not close. SPY’s average daily volume of ~70 million shares and its massive options open interest make it the most liquid ETF on the planet. Bid-ask spreads in SPY options are tighter than any competitor by a wide margin. If you’re selling covered calls, buying puts for portfolio hedges, or trading intraday, the cost of SPY’s higher expense ratio is a rounding error compared to the execution advantages you gain.
Cost-First Investors
SPLG (SPYM). If you’re laser-focused on minimizing every basis point and you never plan to use options or make frequent trades, SPLG’s 0.02% expense ratio gives you the cheapest S&P 500 exposure available. Just accept that you’re trading liquidity for cost efficiency — at the retail order sizes most investors use, this tradeoff is entirely reasonable.
VOO vs IVV: Is There Any Real Difference?
Practically speaking, no. Both charge 0.03%, both are open-end funds, both track the same S&P 500 index, and both have trailing 10-year returns within a few basis points of each other. The differences people argue about online — dividend reinvestment timing, share price (VOO is ~$500+, IVV is ~$600+) — are noise for most investors.
The choice often comes down to:
- Broker ecosystem: Vanguard clients may get preferential features with VOO; iShares/BlackRock products often integrate better on Fidelity and some international platforms.
- Tax-loss harvesting pairs: Some investors hold one and use the other as a “substantially different” swap partner for tax-loss harvesting — though the IRS wash-sale rule’s application here is debated and worth discussing with a tax professional.
- Personal preference: Brand familiarity and institutional trust are real factors for investors who plan to hold for decades.
If you’re wondering whether diversifying across S&P 500 weighting approaches makes sense, the equal-weight vs. market-cap ETF comparison (VOO vs RSP) lays out when a different weighting strategy might be worth considering.
Our Verdict: Ranked by Investor Type
| Investor Type | Best ETF | Reason |
|---|---|---|
| Long-term buy-and-hold | VOO or IVV | 0.03% fee, open-end structure, ample liquidity |
| Active trader / options user | SPY | Unmatched liquidity, deepest options market |
| Cost-first, patient holder | SPLG (SPYM) | Cheapest at 0.02%; lower volume is fine for retail |
| Vanguard platform user | VOO | Native integration, $1T+ AUM credibility |
| Fidelity / international platform | IVV | iShares integration, BlackRock infrastructure |
The bottom line is straightforward: if you’re investing for the long term and you’re not trading options, pick VOO, IVV, or SPLG and ignore SPY. The three are close enough that you won’t regret choosing any of them — but you will, over 30 years, wish you hadn’t chosen SPY.
Once you’ve picked your S&P 500 ETF, the more important decisions are how much to put in and when. If you’re wrestling with whether to invest a lump sum now or spread it over time, the dollar-cost averaging vs. lump-sum breakdown has the data-backed answer. And if you want income alongside your index exposure, see the best high-yield dividend ETFs for 2026 for how SCHD, VYM, and JEPI stack up.
Found this useful? Bookmark it — the fee math and fund details in this comparison hold up for years, and it’s a good reference to revisit when others ask you which S&P 500 ETF they should buy.
This article is for informational purposes only and is not investment advice. Do your own research before making any investment decisions.