
When the 10-year Treasury yield sits near 4%, every quality-dividend investor faces the same question: does paying a premium for 50 years of consecutive dividend growth still make sense — or does the bar at 25 years give you enough quality without giving up too much yield or optionality? Dividend Kings and Dividend Aristocrats are both shortlists of companies that have proven they can grow dividends through recessions, rate cycles, and market panics. But in a higher-for-longer rate environment, the differences between the two matter more than most investors realize.

What Are Dividend Aristocrats? (25+ Years of Consecutive Dividend Growth)
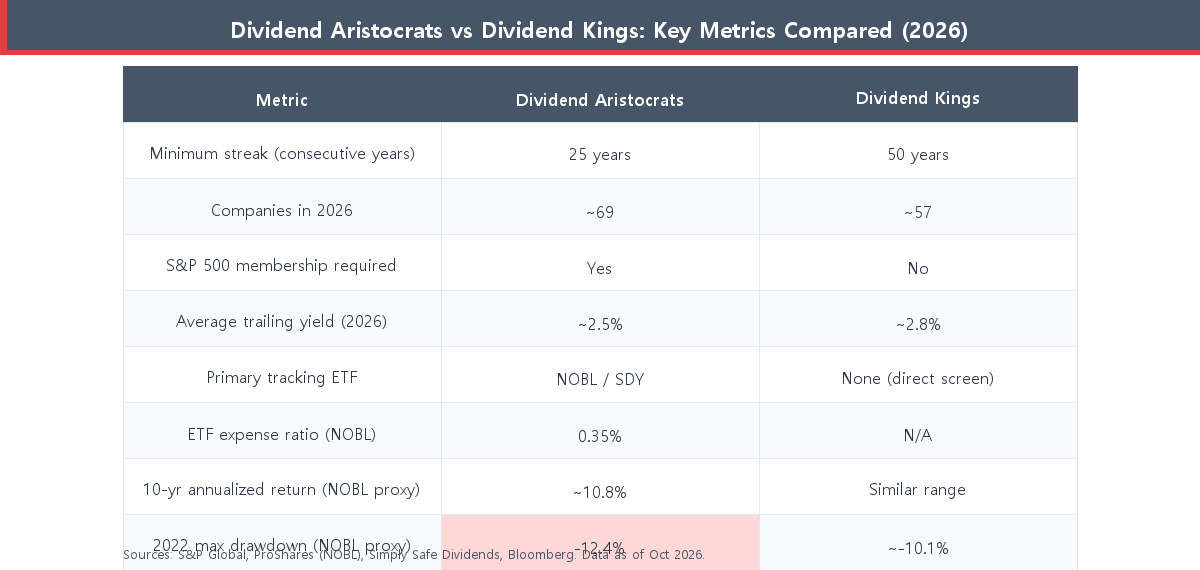
To earn the Dividend Aristocrat title, a company must clear two hurdles: it must be a member of the S&P 500, and it must have raised its dividend every single year for at least 25 consecutive years. As of October 2026, there are approximately 69 Dividend Aristocrats in the index — a list that spans consumer staples, industrials, financials, and healthcare (Source: S&P Global, October 2026).
The S&P 500 membership requirement is not just a bureaucratic filter. It means Aristocrats are mid-to-large-cap U.S. companies with meaningful analyst coverage, liquidity, and meaningful market-cap representation. It also means the list turns over: companies that exit the S&P 500 — due to acquisition, a dividend cut, or a dramatic market-cap drop — lose their Aristocrat status immediately. That turnover keeps the list dynamic and arguably self-cleaning.
The S&P 500 Filter — Why It Matters
Because the S&P 500 gates membership on market cap and float, the Aristocrats list skews toward large-cap quality names. Coca-Cola (KO, 62-year streak), Johnson & Johnson (JNJ, 63-year streak), and Procter & Gamble (PG, 70-year streak) are all Aristocrats. Many of these are also Dividend Kings — but the reverse is not always true. Smaller-cap companies with exceptional dividend streaks may qualify as Kings while failing the S&P 500 size threshold. That indexing constraint gives Aristocrats more liquidity and easier passive-fund access.
NOBL: The Benchmark Aristocrats ETF
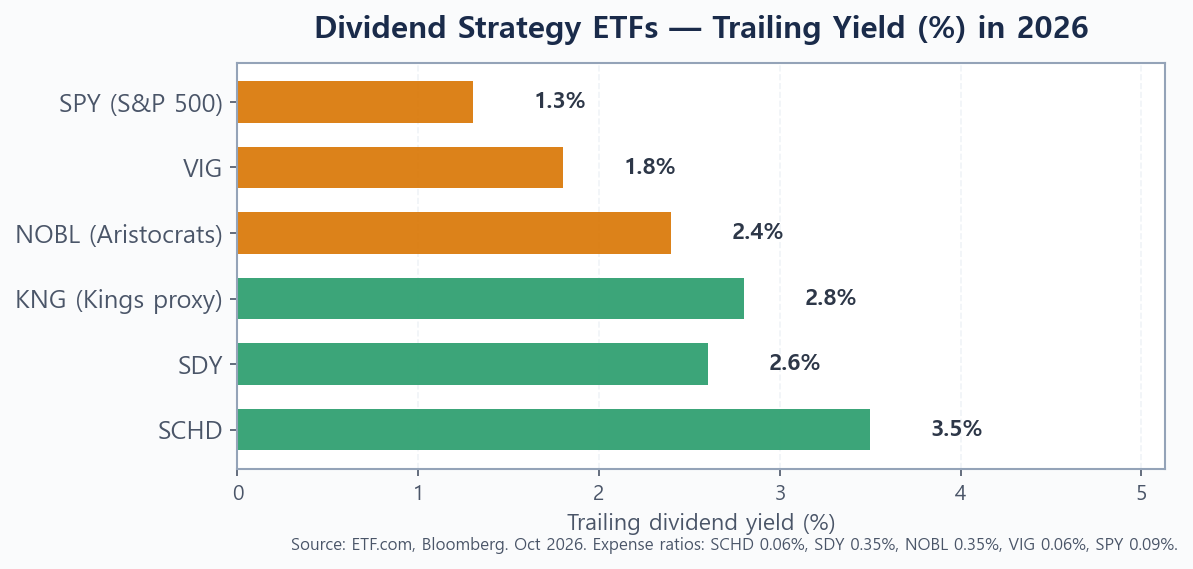
The ProShares S&P 500 Dividend Aristocrats ETF (NOBL) is the de facto benchmark for passive Aristocrats exposure. It holds all eligible Aristocrats in an equal-weight structure, charges 0.35% in annual expense ratio, and carries a trailing yield of roughly 2.4% as of October 2026 (Source: ProShares, October 2026). Equal weighting prevents mega-caps from dominating and gives smaller Aristocrats a meaningful allocation — which has historically improved drawdown protection at the cost of some bull-market upside relative to market-cap-weighted indexes.
Want to compare NOBL against more yield-focused dividend growth funds? See our full breakdown of SCHD vs VIG: which dividend growth ETF is better and the wider best high-yield dividend ETFs for 2026.
What Are Dividend Kings? (50+ Years of Unbroken Dividend Increases)
Dividend Kings double the Aristocrats’ minimum bar: 50 or more consecutive years of annual dividend increases. There is no S&P 500 membership requirement and no minimum market-cap threshold. The 2026 Kings list contains approximately 57 companies (Source: Simply Safe Dividends, October 2026) — a smaller but more time-tested group whose streaks have survived the stagflation of the 1970s, multiple recessions, two global financial crises, a pandemic, and now a protracted higher-rate cycle. If a company is still raising its dividend after 50 years of economic turbulence, that is a powerful signal of competitive durability.
No Index Requirement — Broader but Smaller
The absence of an S&P 500 gate means the Kings list includes smaller-cap and mid-cap names that would never qualify for Aristocrat status. Companies like Northwest Natural Holding (NWN, 68-year streak) and California Water Service Group (CWT, 58-year streak) are bona fide Kings but are not S&P 500 members. This makes the Kings universe more diverse by size — an advantage for income diversification, but it also means some constituents have lower liquidity and thinner sell-side coverage.
The average trailing yield on the Kings list sits at roughly 2.8% in 2026 — modestly higher than Aristocrats — reflecting that many Kings are mature, slow-growth businesses in utilities, water infrastructure, and consumer staples that distribute the majority of their free cash flow (Source: Simply Safe Dividends, October 2026).
No Major Dedicated ETF — An Important Practical Wrinkle
Unlike Aristocrats, which have NOBL and SDY as liquid, index-tracked vehicles, there is no major ETF that tracks Dividend Kings exclusively as of 2026. Investors who want pure Kings exposure must build a direct-stock portfolio of individual names or use a broader dividend-growth screener. This is a meaningful real-world difference: Aristocrats are easier and cheaper to access passively, while Kings require more active construction and ongoing monitoring.
Dividend Kings vs Dividend Aristocrats: Head-to-Head Comparison
The video above by Dividend Bull breaks down the structural differences between Kings, Aristocrats, and Champions clearly — a useful foundation before digging into the rate-environment nuances below.
Yield, Payout Safety & Dividend Growth Rate
On raw yield, Kings win narrowly: roughly 2.8% vs 2.5% for Aristocrats on a trailing basis as of October 2026. But yield alone misses the safety picture. Kings companies have maintained dividend growth through more economic cycles, translating into a historically lower probability of a cut in any given year — approximately 1% for Kings vs 2% for Aristocrats (Source: Simply Safe Dividends historical research, 2026). Both are very safe by equity standards, but the extra 25 years of streak gives Kings a slight reliability edge.
For dividend growth rate, Aristocrats have a measurable advantage: a 5-year average dividend growth rate of roughly 6.5–7% vs 5–5.5% for Kings. The structural reason is straightforward — a company with a 50-year streak is typically a mature, cash-flow-stable business (utilities, water, consumer staples) focused on payout consistency rather than aggressive dividend expansion. A newer Aristocrat at the 25–30 year mark may be in a faster phase of its payout arc.
Total Return & Drawdown Protection
Using NOBL as an Aristocrats proxy, the 10-year annualized total return is approximately 10.8%, compared to the S&P 500’s roughly 12.5% over the same period (Source: Bloomberg, October 2026). The underperformance vs the broad index is real and largely explained by structural underweight in mega-cap tech — Aristocrats simply cannot hold the highest-multiple growth names that have driven index returns. The tradeoff: NOBL’s maximum drawdown in 2022 was approximately -12.4%, versus -18.1% for the S&P 500. Kings show a similar defensive pattern — lower returns over full bull cycles, meaningfully better capital preservation in downturns.
For a broader perspective on why dividend approaches have been staging a comeback, see our analysis of why dividend stocks are finally beating the S&P 500.
Sector Exposure Differences
Both groups are concentrated in consumer staples, industrials, healthcare, and financials. The key divergence: Aristocrats — through the S&P 500 filter — carry a higher technology representation than Kings, because some large-cap tech companies have recently crossed the 25-year streak threshold. Kings, by contrast, tilt more heavily toward utilities and water-infrastructure companies that carry long streaks but fall outside the S&P 500. In a rising-rate world, this sector mix matters significantly — utilities face direct rate competition, while financials can benefit from higher margins.
How 4% Treasury Rates Reshape the Dividend Calculus
When the 10-year Treasury yields 4%, it creates what analysts call a “yield competition” problem for dividend stocks: a risk-free government bond now pays close to — or in some periods more than — what many quality dividend stocks yield, without any equity risk. This compression has been a structural headwind for dividend stocks since 2022, and it affects both Aristocrats and Kings, though not equally.
Why Higher Rates Compress Dividend Stock Valuations
Dividend stocks are frequently valued using a dividend discount model (DDM), where future dividends are discounted back to present value. A higher risk-free rate raises the discount rate, mechanically compressing the present value of future cash flows. This effect is most acute for companies with low near-term yields but high long-term growth expectations — which, somewhat counterintuitively, includes many faster-growing Aristocrats more than slower-yielding Kings. An Aristocrat delivering 7% annual dividend growth at a 2.0% starting yield gets hit harder by rate compression than a King at 3.2% yield and slower growth, because more of its intrinsic value is embedded in distant future dividends.
Which Group Is More Rate-Resilient?
On this dimension, Kings arguably hold up somewhat better — for two reasons. First, their higher average yield creates a “current income cushion” at elevated rate levels. When Treasuries yield 4%, a King paying 2.8–3.2% is comparatively less disadvantaged than an Aristocrat at 2.0%. Second, many Kings are utilities and infrastructure companies with regulated, contracted cash flows that investors historically accept at 3–4% yield because the dividends are highly predictable — a quasi-bond profile that reprices in sync with rates rather than being severely dislocated by them.
That said, Aristocrats with meaningful financials and industrials exposure can actually benefit from a higher-rate environment through improved net interest margins and pricing power. The rate impact on either group is heterogeneous — it depends heavily on which individual companies or which specific ETF you hold rather than on group membership alone.
For a more detailed framework on navigating rate risk in dividend portfolios, our dedicated guide on how Fed rate hikes affect dividend stocks and the portfolio-level approach in how to rebalance when rates rise are worth reading alongside this comparison.
Best ETFs to Access Each Strategy in 2026
For Aristocrats, two strong liquid ETF options exist:
- NOBL (ProShares S&P 500 Dividend Aristocrats ETF) — equal-weight, all ~69 Aristocrats, 0.35% expense ratio, trailing yield ~2.4%. Best for balanced exposure without mega-cap concentration risk.
- SDY (SPDR S&P High Yield Dividend Aristocrats ETF) — broader universe (25-year minimum, no S&P 500 gate), yield-weighted construction, 0.35% expense ratio, trailing yield ~2.6%. Its wider screen means it partially overlaps with Kings territory.
For Dividend Kings specifically, no major dedicated ETF exists in 2026. Practical approaches:
- Direct stock portfolio — Screen for 50-year streaks on Simply Safe Dividends, Finviz, or the DRIP Investing Resource Center and build a 15–25-stock portfolio. More work, but maximum fidelity to the Kings definition.
- Broad dividend-growth funds as proxies — SCHD, VIG, and DGRO include many Kings as constituents, though they are not Kings-only vehicles. These funds offer significantly lower expense ratios (0.06%) and broader diversification. The tradeoff is dilution with non-Kings names.
For deeper ETF comparisons, see our analyses of DGRO vs SCHD vs VIG and SPYD vs VYM vs SCHD.
Dividend Kings vs Aristocrats: Which Is Right for You?
Both strategies serve the same core purpose — owning companies with the financial strength and management discipline to grow dividends through adversity — but they suit different investor profiles:
- Lean toward Aristocrats (via NOBL or SDY) if you want passive ETF access without building a stock portfolio, you value a higher dividend growth rate over raw yield, and you prefer a well-researched index benchmark with clear rules.
- Lean toward Kings (direct screen) if you are willing to build and manage an individual stock portfolio, you want the maximum quality filter, you prefer higher current yield, and you want names that are genuinely insulated from S&P 500 index reconstitution decisions.
- Combine both — Many long-term income investors hold a core dividend-growth ETF (SCHD or VIG) alongside 10–15 individual Kings positions. The ETF provides diversification and cost efficiency; the Kings positions add conviction and income reliability from the longest-proven compounders.
If you are reinvesting dividends automatically, ensure your brokerage supports a DRIP for each position — our guide to how to set up a DRIP on Fidelity, Schwab, and Vanguard walks through the steps.
Frequently Asked Questions
Can a stock be both a Dividend Aristocrat and a Dividend King?
Yes. Any S&P 500 company with 50+ consecutive years of dividend growth qualifies as both. Examples include Coca-Cola, Johnson & Johnson, and Procter & Gamble. Roughly half of all current Kings are also Aristocrats.
Which group has performed better historically?
Backtests show broadly similar risk-adjusted returns, with Aristocrats carrying a slight edge in total return due to faster dividend growth and more dynamic constituent turnover. Kings have shown marginally lower drawdowns in deep recessions, reflecting more stable cash-flow profiles and higher starting yields.
Do Dividend Kings or Aristocrats hold up better in a recession?
Both groups have significantly outperformed the broad market in recessions historically. Kings edge out Aristocrats slightly on drawdown protection due to higher starting yields (providing more income cushion) and essential-business sector concentration. Neither group is immune to equity market declines.
Are there Dividend Kings that are not in the S&P 500?
Yes — roughly 20–25% of current Kings are not S&P 500 members. Smaller utility and water companies with exceptional streaks make up most of this non-S&P subset, making them ineligible for the Aristocrats list regardless of streak length.
Conclusion
In a 4% rate world, both Dividend Kings and Dividend Aristocrats remain compelling quality-income strategies — but they suit distinct investor needs. Aristocrats deliver liquid, passive ETF access, slightly faster dividend growth, and a well-defined index benchmark. Kings offer the maximum quality filter, marginally higher yield, and a universe not constrained by index bureaucracy — but require active stock selection given the absence of a major dedicated ETF.
Neither strategy will outperform a pure-growth index in a strong bull market. Both are designed for investors who prioritize income reliability and capital preservation — a tradeoff that looks increasingly rational when risk-free rates are at 4% and equity valuations remain elevated. The best approach for many income investors may simply be to use one as a foundation (NOBL or SCHD for core passive exposure) and the other as a lens for individual stock selection (Kings screening for highest-conviction picks).
Found this useful? Bookmark it for when you revisit your dividend strategy. For next steps, explore why dividend stocks are finally beating the S&P 500 in 2026 and the specific ETFs leading the charge.
This article is for informational purposes only and is not investment advice. Do your own research before making any investment decisions.