

On September 16, 2026, the Federal Reserve raised its benchmark rate by 25 basis points to a target range of 3.75%–4.00% — the first rate hike since 2023. For investors already watching a dramatic rotation unfold all year, the decision was a confirmation, not a surprise. And for anyone still holding a growth-heavy portfolio, it was a wake-up call worth heeding.
Through September 2026, the Russell 1000 Value index is up +14.4% year-to-date, while the Russell 1000 Growth has gained just +1.8%. That 12.6 percentage-point gap is the widest since the 2022 tightening cycle — and the September hike suggests it is not closing anytime soon. This guide explains why the gap exists, what history says about value in rate-hike environments, and how to position your portfolio for what comes next.
What the September 2026 Fed Rate Hike Actually Did to Markets
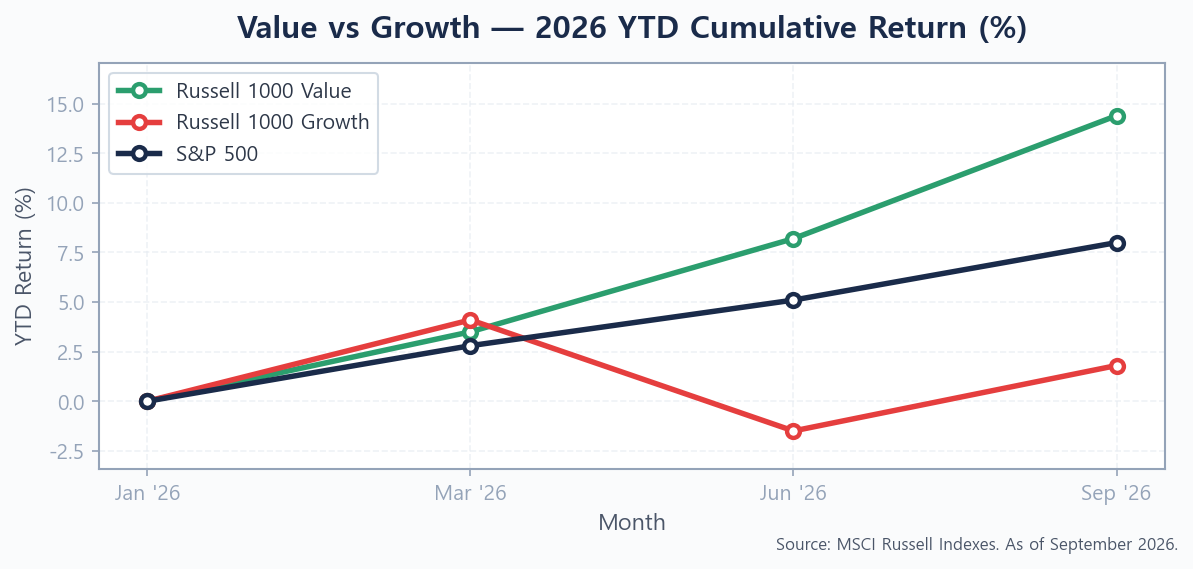
The September hike was widely telegraphed, but the market’s reaction still revealed the underlying stress. Technology-heavy indices fell 1.5–2% on announcement day. Financials, energy, and industrials — the traditional heartland of value stocks — barely moved. The 10-year Treasury yield pushed to 4.85%, reinforcing a key pressure point: when the risk-free rate is near 5%, the hurdle rate for owning speculative, long-duration growth assets rises significantly.
The macro backdrop behind the hike matters. Core PCE inflation had reaccelerated to 4.0% by mid-2026 (Source: BLS, September 2026), driven by sticky services prices and an energy rebound. After cutting rates six times in 2024 and pausing throughout most of 2025, the Fed concluded that the easing had gone too far. The September hike effectively reset the regime: higher for longer is back on the table, with futures markets now pricing in a strong probability of one additional hike before end of 2026.
For a primer on the four channels linking Fed rate decisions to equity markets, see How Fed Rate Decisions Affect the Stock Market.
Why Rate Hikes Hurt Growth Stocks More Than Value Stocks
The Discount Rate Effect: Why Growth Stocks Have “Equity Duration”
Think of a high-growth company as a very long-duration bond. Its intrinsic value rests almost entirely on cash flows expected 5, 10, or even 15 years into the future. When the discount rate rises — which is exactly what happens when the risk-free rate climbs — those distant cash flows are worth less in today’s dollars. This is the equity equivalent of what rising rates do to long-dated bonds: they fall harder in price than short-term notes.
Value stocks behave differently. Their earnings are front-loaded: they trade at low price-to-earnings multiples precisely because investors can already see most of their cash flows in the near term. A higher discount rate shaves some value off, but the effect is far smaller than it is for a company priced at 30x earnings on the expectation of hypergrowth by 2031.
The current numbers make this concrete. The S&P 500 Growth index trades at a blended forward P/E of roughly 30.7x. The S&P 500 Value index sits at 15.9x. At a 4.85% 10-year yield, that valuation gap demands justification — and in the post-hike September 2026 environment, many investors are no longer willing to pay for it on faith alone.
Historical Evidence — Value Premium in Past Fed Hike Cycles
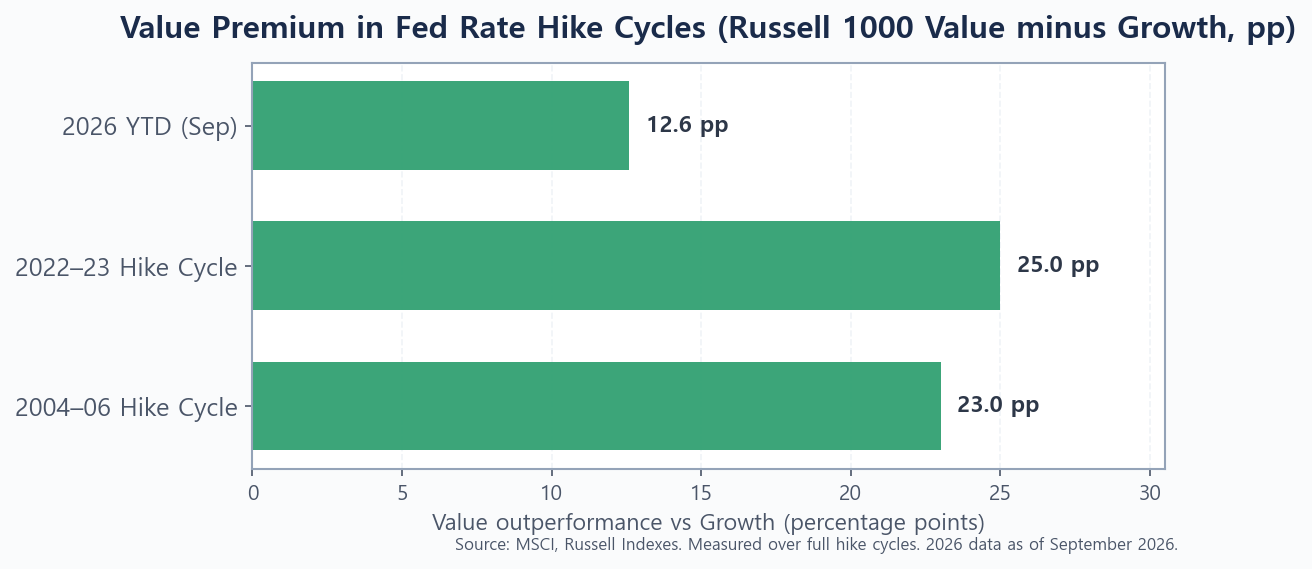
History does not repeat, but it rhymes — especially on this question. In the 2004–2006 tightening cycle, when the Fed raised rates 17 consecutive times from 1.00% to 5.25%, the Russell 1000 Value gained +42% over the full cycle while the Russell 1000 Growth gained just +19%. Value outperformed by 23 percentage points.
The 2022–2023 hike cycle told an even cleaner story. Value fell a modest 5% as rates surged, while Growth was crushed by 30%. Investors who held a value tilt lost far less and recovered far faster when conditions normalized.
The one notable exception is the 2015–2018 cycle, when Growth outperformed despite steady hikes. The key difference: those increases were exceptionally gradual — just 9 hikes over 3 years from 0.25% to 2.50% — and they coincided with the explosive early phase of the cloud computing and mobile earnings boom. When actual earnings growth is spectacular enough, it can override discount-rate math. The 2026 environment is different: the AI capex cycle is maturing, and growth valuations entered the year already stretched at 30–35x forward earnings.
For deeper context on why value stocks have an academic basis for outperformance over market cycles, the video below from Ben Felix examines the factor-investing evidence:
Value ETFs vs Growth ETFs in 2026: Side-by-Side Comparison
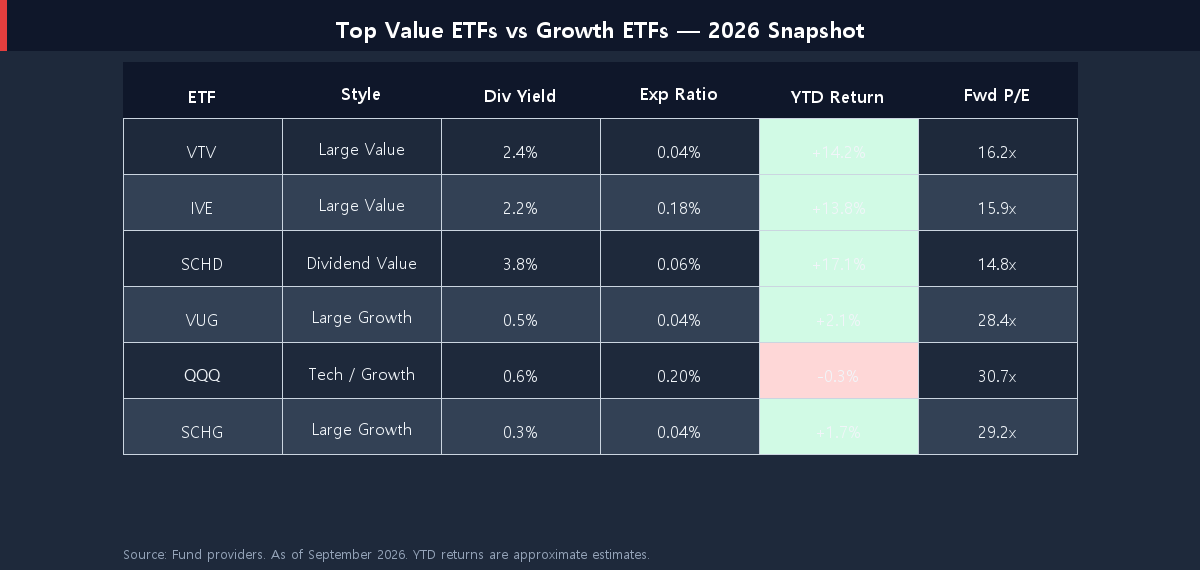
Most retail investors are better served by ETFs that systematically capture the value or growth factor than by picking individual stocks. Here is how the major options stack up as of September 2026:
Value ETFs — VTV, IVE, SCHD have all outperformed by wide margins this year. SCHD’s 3.8% dividend yield is particularly relevant in a world where short-term Treasuries are yielding nearly 5%: the dividend screen provides additional quality filtering, and at current prices you are not sacrificing much income to own equities. VTV and IVE offer broader large-cap value exposure at rock-bottom expense ratios.
Growth ETFs — QQQ, VUG, SCHG have struggled. QQQ is fractionally negative year-to-date, a jarring contrast to its multi-year dominance. Its heavy concentration in mega-cap tech (Microsoft, Apple, NVIDIA, and Alphabet together represent roughly 40% of the fund) means it is effectively a leveraged bet on continued AI spending growth at current multiples. VUG and SCHG are similarly stretched on valuation.
(If you’re focusing on the income angle, our full breakdown of SCHD vs VIG: Best Dividend Growth ETF for 2026? covers the dividend-value overlap in detail.)
Where to Invest Now: 3 Strategies by Risk Profile
There is no one-size-fits-all answer, but here is a framework built around the current environment: rates at ~4%, core inflation at 4.0%, strong corporate earnings in financials and energy, and above-average valuations in high-growth tech. The three strategies below are designed for different investor profiles — not as prescriptions, but as starting points for your own allocation thinking.
Conservative: Deep Value + Dividend Tilt
If you are within 10 years of retirement or simply want to minimize drawdown risk, a high-value, income-heavy allocation fits well today:
- 60% large-cap value (VTV or IVE) — broad exposure to financials, energy, healthcare, and industrials
- 20% dividend equity (SCHD) — quality screen plus 3.8% yield provides a meaningful income cushion against equity volatility
- 20% short-term Treasuries or T-bills — earning 4.7–5.0% with essentially zero equity risk
This portfolio is designed to generate income, limit deep drawdowns, and keep pace with inflation. It intentionally gives up some upside if AI earnings accelerate further — a trade many conservative investors will consider worthwhile at today’s stretched growth valuations.
For income-focused investors who want to go deeper on the ETF side, see Best High-Yield Dividend ETFs for 2026.
Balanced: Core Value + Quality Growth Blend
For investors with a 5–15 year horizon who want growth exposure but acknowledge the macro headwinds, a value-tilted core works well:
- 40% large-cap value (VTV) — the defensive anchor
- 30% total market or S&P 500 (VOO) — preserves growth exposure at market weight without concentration in Nasdaq
- 20% quality-factor blend (QUAL or MOAT) — growth companies with strong balance sheets, not just price momentum
- 10% short-term bonds — inflation protection and dry powder for opportunities
This is a slightly value-tilted version of a classic 90/10 portfolio. An important nuance: VOO is currently about 30% technology, which means even your “value anchor” allocation maintains substantial growth exposure. You do not need to pile into QQQ to participate in future AI gains.
For a full step-by-step guide on repositioning in a rising-rate environment, see How to Rebalance Your Portfolio When Interest Rates Are Rising.
Aggressive: Stay in Growth, But Add Hedges
If you believe the AI earnings story has more runway and that strong corporate profit growth can override discount-rate headwinds (as it did in 2015–2018), you can maintain a heavy growth position — but protect the downside:
- 60% growth ETFs (QQQ or VUG) — core growth bet on continued AI earnings expansion
- 20% value as a partial hedge (VTV) — an offset if rates spike further and compression accelerates
- 20% cash or T-bills — earning nearly 5%, with full optionality if a correction creates a buying opportunity
The key risk in this profile is a multiple compression event: if the 10-year yield pushes past 5.5% and earnings guidance disappoints, QQQ could see a 25–30% drawdown. Sizing the cash position accordingly is the most straightforward hedge available to retail investors.
Conclusion
The September 2026 Fed rate hike was a confirmation, not a catalyst. Value stocks had been outperforming growth for most of the year as investors repriced long-duration growth assets in a world of persistently elevated inflation and a Fed that re-found its hawkish resolve. The 14.4% vs 1.8% YTD gap between the Russell 1000 Value and Growth indices is the widest since the 2022 cycle — and historical patterns suggest the rotation has room to continue as long as the Fed holds rates above 3.5%.
That does not mean growth stocks are permanently broken. Earnings matter enormously: if Nvidia, Microsoft, and their peers continue posting 30%+ earnings growth, stretched valuations can partially sustain themselves. But the asymmetry has shifted. Value now offers better downside protection, meaningful income, and historically validated outperformance in hike cycles. Growth requires everything to go right — sustained AI capex, margin expansion, and patient capital willing to wait for distant cash flows.
For most investors, some tilt toward value — through VTV, SCHD, or a quality-factor blend — is a rational response to the current macro environment. How much you tilt depends on your time horizon, income needs, and conviction in the AI earnings cycle continuing through a period of higher borrowing costs.
For context on why dividend-oriented value strategies have performed so well in 2026, see Why Dividend Stocks Beat the S&P 500 in 2026 (Top ETFs).
Found this useful? Bookmark it so you can revisit when the market moves.
This article is for informational purposes only and is not investment advice. Do your own research before making any investment decisions.