
Two ETFs, one benchmark idea — and a 25-percentage-point performance gap in 2026. VWO and EEM both promise broad exposure to emerging markets, yet they have taken dramatically different paths this year. The reason comes down to a single index methodology decision: does South Korea count as an emerging market? That answer, and the AI-fueled memory chip boom it amplifies, has separated a good year from a great one for investors in these funds. This guide breaks down the difference so you can decide which fits your portfolio.
The One Index Decision That Splits VWO and EEM
VWO and EEM look similar on the surface. Both hold hundreds of companies across China, India, Brazil, Taiwan, and other developing economies. But they track different indexes — and that single fact reshapes everything from country weights to top holdings.
Why VWO Excludes South Korea (The FTSE Rule)
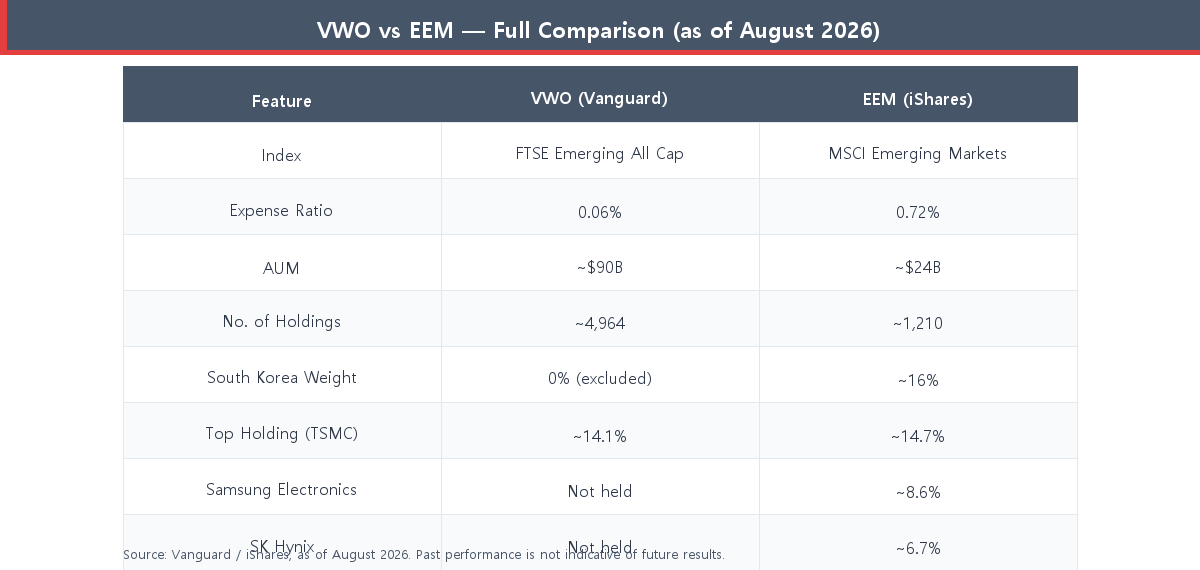
VWO tracks the FTSE Emerging Markets All Cap China A Inclusion Index. FTSE Russell, the British index provider, classifies South Korea as a developed market — the same tier as Japan, the UK, and Australia. As a result, VWO holds zero Samsung Electronics and zero SK Hynix. Korean chipmakers simply do not exist in VWO’s universe, regardless of how fast they grow.
This has been the rule for years, but it became costly in 2026. The global AI infrastructure buildout — data centers, training clusters, high-bandwidth memory — ignited insatiable demand for the DRAM and HBM chips that Samsung and SK Hynix dominate. VWO investors missed every basis point of that rally.
Why EEM Includes South Korea — and Why It Matters in 2026
EEM tracks the MSCI Emerging Markets Index. MSCI still classifies South Korea as an emerging market, pending a reclassification review that has been ongoing for years. That classification means EEM holds Samsung Electronics at roughly 8.6% and SK Hynix at roughly 6.7% of the fund — two of the top-three positions (Source: iShares, as of August 2026).
Add Taiwan Semiconductor Manufacturing (TSMC), which sits at about 14.7% in EEM, and you have a fund that is heavily weighted toward the AI chip supply chain. When hyperscalers — Nvidia, Microsoft, Amazon, Google — spent hundreds of billions on AI infrastructure in 2025 and 2026, EEM captured the Asian semiconductor beneficiaries directly. If you are curious about the underlying stocks, our breakdown of NVIDIA vs TSMC: Which AI Chip Stock Is the Smarter Long-Term Buy in 2026? covers the individual names in detail.
2026 Performance Showdown: EEM’s 25% Lead Explained
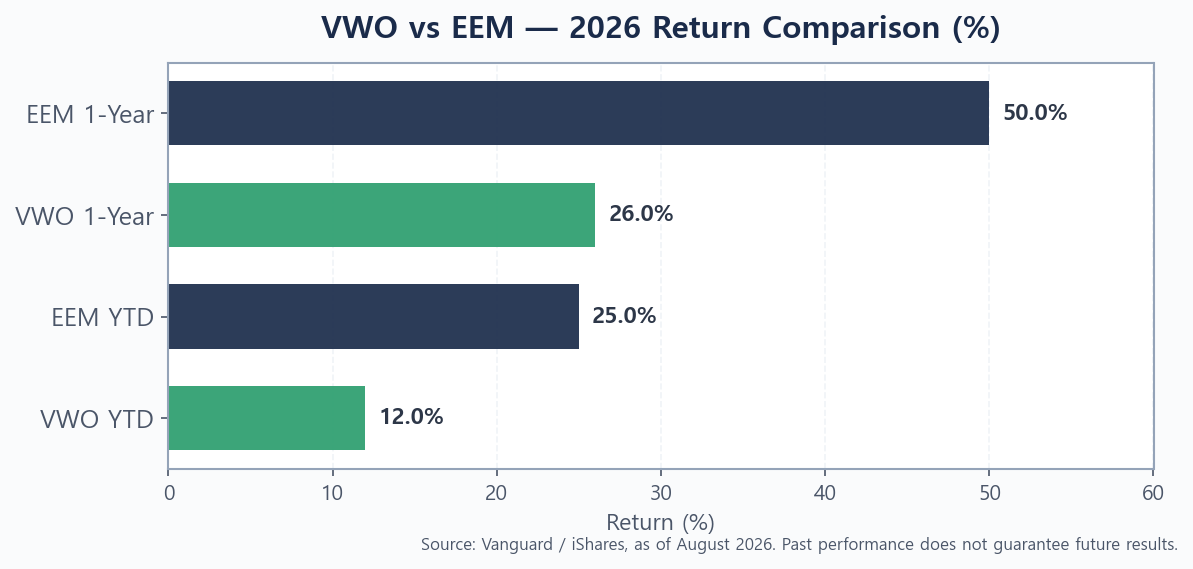
The numbers tell a stark story. Through August 2026, EEM is up approximately 25% year-to-date, while VWO has returned about 12% over the same period. On a trailing one-year basis, EEM has surged roughly 50% versus VWO’s 26% (Source: iShares / Vanguard, as of August 2026).
The gap is not a fluke. South Korea’s KOSPI index has been one of the best-performing large markets globally, driven almost entirely by Samsung and SK Hynix orders tied to AI memory demand — specifically High Bandwidth Memory (HBM) chips. EEM’s roughly 16% Korea weight acted as a high-octane accelerant. VWO, with 0% Korea, simply watched from the sidelines.
It is worth noting that VWO’s 12% YTD return is not bad — it reflects solid gains in India, China, and Taiwan. But in a year when semiconductors are the story, missing Korea is like missing the point.
The video below offers a thorough walkthrough of how these two funds compare structurally, which helps contextualize why the performance gap materialised the way it did in 2026.
VWO vs EEM Head-to-Head: Full Comparison
Cost and Scale
This is where VWO wins decisively and without debate. VWO charges 0.06% per year — six basis points — making it one of the cheapest ways to access any equity market on Earth. EEM charges 0.72%, twelve times more (Source: Vanguard / iShares, as of August 2026).
On assets under management, VWO is the giant at roughly $90 billion, compared to EEM’s approximately $24 billion. The size difference matters for liquidity, but both ETFs trade hundreds of millions of dollars daily, so bid-ask spreads are negligible for most retail investors. Where the cost difference truly compounds is over a decade: a 0.66% annual drag on a $50,000 position costs over $5,000 in foregone returns at a 7% gross return — before taxes.
Holdings Depth and Concentration
VWO holds roughly 4,964 securities, giving it genuine all-cap breadth — small and mid-cap emerging market companies are included alongside the giants. EEM holds approximately 1,210 securities, focused on large- and mid-cap names only.
VWO’s top single position is TSMC at about 14.1%. EEM’s top three are TSMC (~14.7%), Samsung (~8.6%), and SK Hynix (~6.7%). That means EEM’s top three holdings alone represent nearly 30% of the fund — a meaningful concentration in AI-adjacent chip names. For investors who believe in the continued AI chip supercycle, that concentration has been a tailwind. For those concerned about chip-cycle volatility, it is a risk to price in.
Both funds have significant China exposure — typically 25–30% of the portfolio — via Alibaba, Tencent, and other Chinese mega-caps. Neither is immune to China-related geopolitical risk. If you want to explore how to think about concentration risk across your total equity allocation, our post on Equal-Weight vs Market-Cap ETF in 2026 covers the tradeoff in a domestic US context that translates well to EM.
Who Should Choose VWO — and Who Should Choose EEM?
VWO is the better fit if you:
- Are a long-term, cost-conscious buy-and-hold investor. The 0.06% expense ratio is nearly unbeatable, and compounding over 20+ years makes the fee gap enormous.
- Want the broadest possible EM exposure, including thousands of smaller companies in frontier-adjacent markets.
- Are comfortable owning zero South Korea — or actively prefer the FTSE methodology that places Korea in the developed bucket.
- Are building a three-fund or similar passive portfolio. For a blueprint, see our guide on How to Build a Simple 3-Fund Portfolio in 2026.
EEM is the better fit if you:
- Want South Korean semiconductor exposure within an EM wrapper and believe the AI memory chip cycle has more room to run.
- Are an institutional or active investor who needs to track the MSCI Emerging Markets benchmark — the industry standard referenced by most asset managers.
- Trade options on your EM position. EEM has one of the deepest options markets of any ETF globally, making it the preferred vehicle for hedging or tactical overlays.
- Can stomach paying 0.72% — a fee that is hard to justify for passive investors but may be worth it for those who specifically want the MSCI benchmark or tactical flexibility.
There is also a third path: IEMG (iShares Core MSCI Emerging Markets ETF), which tracks the same MSCI index as EEM but charges only 0.09% — splitting the difference between EEM’s Korea exposure and VWO’s low cost. If MSCI methodology matters to you, IEMG is arguably the more rational retail choice than EEM today.
For investors drawn to the AI angle more broadly, our comparison of QQQ vs SOXX vs BOTZ: Best AI ETF for 2026 covers the dedicated AI-theme ETFs that hold these semiconductor stories even more directly.
Verdict: Which ETF Wins in 2026?
In pure 2026 return terms, EEM wins. The AI chip boom, channelled through Samsung and SK Hynix, gave EEM a performance advantage that no amount of fee savings could offset this year. If you had $10,000 in each at the start of 2026, EEM would be worth roughly $1,300 more through August — despite costing $66 more per year in fees.
But picking the winner of a single year is rarely the right frame for ETF selection. The FTSE vs MSCI debate has been ongoing for a decade. Korea’s classification will eventually change — or the AI chip cycle will cool. When it does, VWO’s cost advantage compounds quietly, every single year, regardless of market conditions.
A pragmatic view: if you are a long-term passive investor who does not actively monitor sector cycles, VWO remains the default choice for its cost, breadth, and simplicity. If you believe the AI memory chip supercycle has another two to three years of runway, EEM (or IEMG for the cost-conscious) captures that thesis more completely. Neither choice is wrong — they are just different bets on how to weight the same universe.
Found this useful? Bookmark it so you can revisit when the market moves. I publish practical investing breakdowns regularly — check back soon.
This article is for informational purposes only and is not investment advice. Do your own research.