
Emerging market bond ETFs are back in the spotlight. With the Fed signaling at least one more rate hike in 2026 and U.S. Treasury yields hovering near multi-year highs, many fixed-income investors are asking whether the extra yield offered by EM debt is still worth the added risk — or whether the window has already closed. Three ETFs dominate the conversation: EMB (iShares JP Morgan USD Emerging Markets Bond ETF), PCY (Invesco Emerging Markets Sovereign Debt ETF), and EMLC (VanEck JP Morgan EM Local Currency Bond ETF). Each takes a distinct approach to EM debt, and picking the wrong one for your situation can quietly erode the yield advantage you were chasing in the first place.
This guide breaks down how EMB, PCY, and EMLC compare across expense ratio, yield, duration, currency risk, and 2026 performance — so you can decide whether emerging market bond ETFs deserve a place in your portfolio right now.

Why Investors Are (Re-)Discovering Emerging Market Bonds in 2026
What EM Bonds Offer That Treasuries Can’t
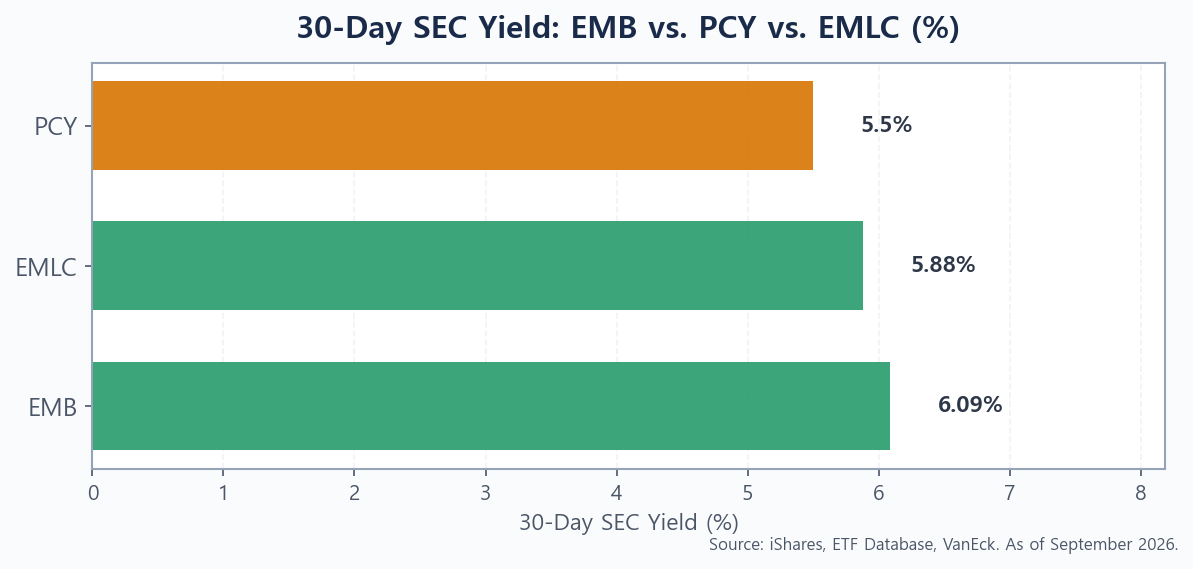
The core appeal is straightforward: yield. While a 10-year U.S. Treasury currently yields around 4.3–4.5%, EMB’s 30-day SEC yield sits at 6.09% (as of September 2026). That’s a spread of roughly 150–175 basis points over the risk-free rate — meaningful income for investors willing to take on sovereign credit and currency risk. Emerging market sovereigns also provide geographic diversification, reducing dependence on the U.S. rate cycle alone. Countries like Brazil, Mexico, Indonesia, and South Africa issue bonds with different growth trajectories and monetary policy timelines, which can dampen portfolio volatility compared to an all-Treasuries approach. For context on how Treasuries themselves work, see our guide on How to Buy US Treasury Bonds as a Foreigner.
The “Higher for Longer” Complication
The complication in 2026 is the Fed. Markets are pricing in one additional rate hike, bringing the overnight rate to a target range of 4.00–4.25%. Historically, a rising-rate environment in the U.S. creates headwinds for EM bonds in two ways. First, higher U.S. rates push up Treasury yields, making risk-free income more attractive relative to EM credit. Second, a stronger dollar — which often accompanies Fed tightening — erodes returns for investors holding local-currency EM bonds. We’ve explored this dynamic at length in our piece on Will the Fed Hike Rates in 2026?. The key question for each ETF below is: how exposed is it to that double squeeze?
EMB vs. PCY vs. EMLC — Head-to-Head Comparison
Expense Ratio, Yield, and Duration at a Glance
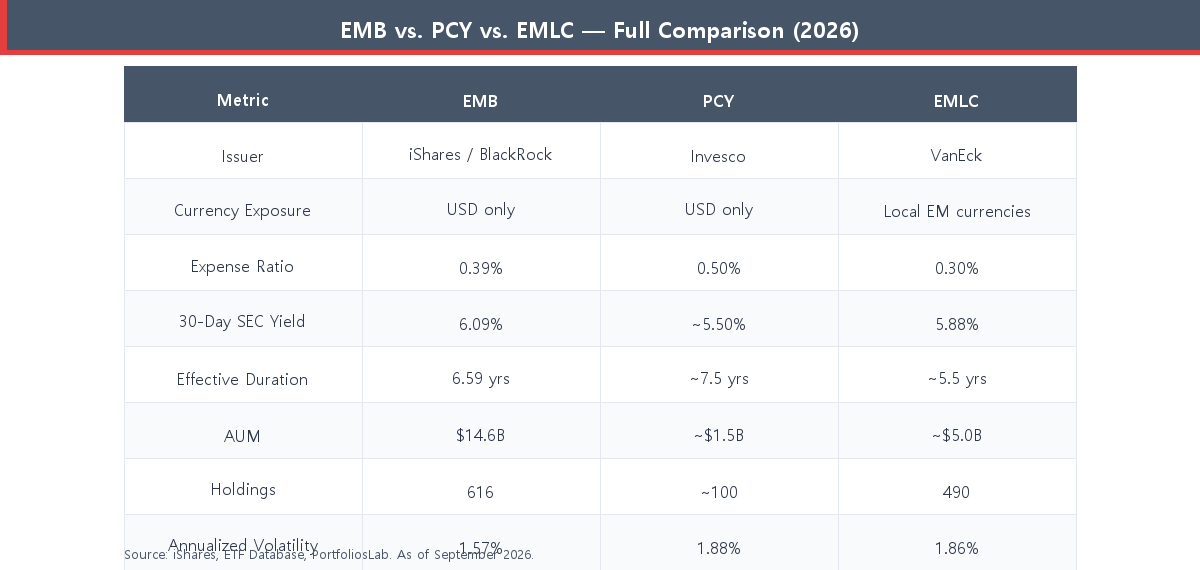
Here is a full side-by-side breakdown of the three major emerging market bond ETFs. All data as of September 2026.
| Metric | EMB | PCY | EMLC |
|---|---|---|---|
| Issuer | iShares / BlackRock | Invesco | VanEck |
| Index | JP Morgan EMBI Global Core | DB EM USD Liquid Balanced | JP Morgan GBI-EM Global Core |
| Currency Exposure | USD only | USD only | Local EM currencies |
| Expense Ratio | 0.39% | 0.50% | 0.30% |
| 30-Day SEC Yield | 6.09% | ~5.5% | 5.88% |
| Effective Duration | 6.59 yrs | ~7.5 yrs | ~5.5 yrs |
| AUM | $14.6B | ~$1.5B | ~$5.0B |
| Number of Holdings | 616 | ~100 | 490 |
EMB is the clear leader by AUM at $14.6 billion — roughly three times EMLC and nearly ten times PCY. Greater assets mean tighter bid-ask spreads and easier entry/exit, which matters for investors who plan to trade actively or hold through volatile periods. PCY’s higher expense ratio of 0.50% is a meaningful drag over a long holding period, especially when EMLC charges just 0.30%. Think of it this way: a $50,000 position in PCY costs you $250 per year in fees vs. $150 in EMLC — a $100 annual drag before any returns are calculated.
USD-Denominated vs. Local Currency: The Core Strategic Choice
The most important structural difference between these three ETFs is not expense ratio or yield — it’s currency. Both EMB and PCY hold bonds denominated in U.S. dollars. When Brazil or Indonesia issues a dollar bond, they promise to pay interest and principal in dollars regardless of what their local currency does. EMLC, by contrast, holds bonds in local currencies — Brazilian reais, Indonesian rupiah, Mexican pesos, and so on. This means EMLC’s returns are directly tied to the performance of those currencies against the dollar.
In a period of dollar weakness, EMLC tends to outperform because the underlying bonds appreciate in dollar terms. In a period of dollar strength — exactly what a Fed rate hike cycle tends to produce — EMLC can get hit from both sides: falling bond prices (rising local rates) and a depreciating local currency. This is the central risk of owning EMLC in 2026, and it’s why investors need to have a view on the dollar before choosing it over EMB or PCY. For a deeper look at how rising rates affect bond positioning, see our analysis on why short-duration bonds outperform in a high-rate environment.
Volatility and Drawdown Risk
Risk data confirms the currency impact. EMB’s annualized volatility sits at approximately 1.57%, making it the least volatile of the three. EMLC and PCY are both more volatile, at roughly 1.86% and 1.88% respectively. PCY’s higher volatility is partly explained by its smaller, more concentrated portfolio (~100 holdings vs. EMB’s 616), which means a single sovereign stress event — a debt restructuring in a smaller EM country — can move the fund more sharply. EMB’s 616 holdings provide far greater diversification across both issuers and maturities. Note that EMB carries a weighted average maturity of 10.78 years, which is still long enough to produce meaningful price swings when Treasury yields move.
2026 Performance Scorecard: How Each ETF Has Fared
Despite the challenging macro backdrop, all three ETFs have posted strong numbers in 2026. PCY leads the pack year-to-date, followed by EMB, with EMLC slightly behind.
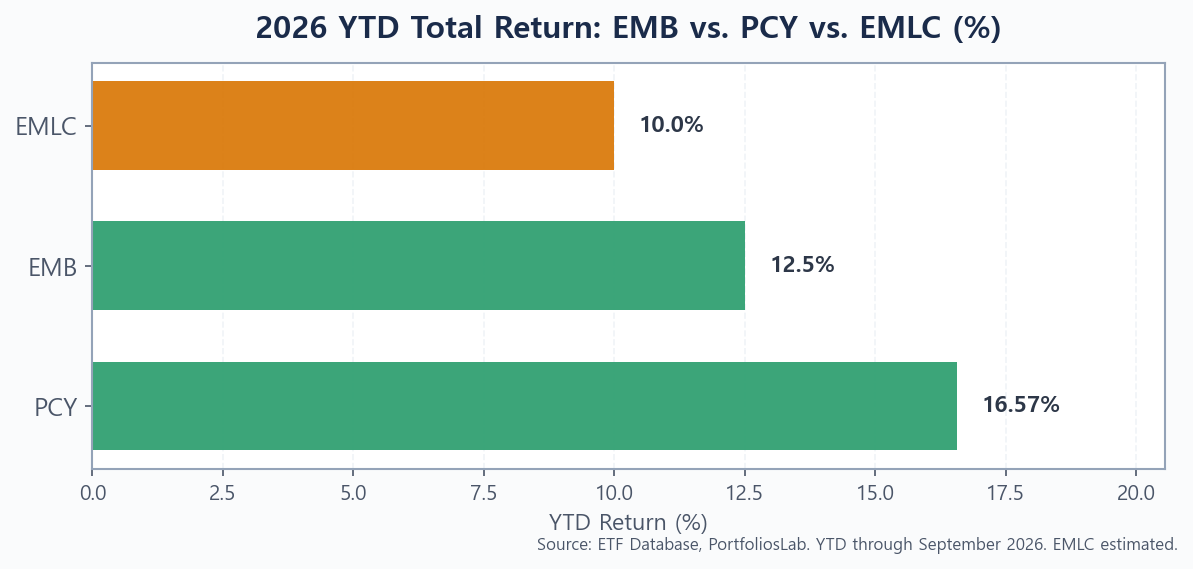
PCY’s outperformance YTD (+16.57%) likely reflects a combination of factors: its more concentrated exposure to sovereigns that benefited from EM debt demand, and possible mean reversion after periods of underperformance. EMB delivered +12.50% YTD with a 1-year return of 13.38%, demonstrating that the broad EM debt space has been rewarding for patient holders. EMLC’s 1-year return of 12.86% is respectable but comes with the currency volatility caveat discussed above — its YTD numbers can shift dramatically depending on when you mark the starting point relative to dollar strength cycles.
One important context: EMB was essentially flat in early January 2026 before the EM debt rally gained momentum through the first half of the year. This reinforces the key lesson: timing entry into emerging market bond ETFs matters more than it does for shorter-duration instruments. If you’re also evaluating Corporate Bonds vs. Treasuries in 2026, the performance gap makes a compelling case for EM debt having recovered faster than expected.
How the Fed Rate Hike Reshapes EM Bond Risk
The expected Fed hike to 4.00–4.25% in 2026 creates a specific stress scenario for EMB and PCY. Analysts at major EM debt desks have flagged a critical threshold: if the 10-year U.S. Treasury yield breaks above 4.50%, EMB faces what can be described as a “double squeeze.” First, the price of underlying sovereign bonds falls as spreads widen relative to the new, higher risk-free rate. Second, the relative attractiveness of EM credit diminishes when investors can earn 4.5% risk-free in dollar terms. Understanding how tariffs are fueling sticky inflation is also relevant here — persistent inflation means the Fed stays hawkish longer, which sustains pressure on duration-sensitive assets like EMB.
The video above from Bloomberg provides useful context on how the EM bond narrative shifted from 2025 into 2026 — particularly the distinction between countries that have reformed their fiscal positions (which have seen spread compression) versus those still carrying high debt loads (which remain vulnerable to a U.S. rate shock).
For EMLC specifically, the Fed hike risk is amplified. A hawkish Fed typically strengthens the dollar, which directly reduces the dollar value of EM local-currency bond payments. Investors holding EMLC need to believe either that EM central banks can hold rates steady or raise faster than the Fed, or that the dollar is near a peak. Neither of those calls is straightforward in September 2026.
Who Should — and Shouldn’t — Own EM Bond ETFs?
EM bond ETFs may be appropriate if you:
- Are building a diversified fixed-income allocation and want yield above 5% without concentrating entirely in U.S. high yield
- Have a time horizon of at least 3–5 years and can tolerate interim drawdowns of 10–15%
- Already hold Treasuries or investment-grade bonds and want a higher-yielding satellite position (5–10% of the total portfolio)
- Believe the dollar has peaked and EM currencies will appreciate — in which case EMLC offers additional upside
EM bond ETFs are probably not right if you:
- Need capital stability or are within 2–3 years of drawing down the funds
- Are not comfortable with sovereign credit risk (Argentina, Turkey, and similar historically volatile issuers appear in EM indexes)
- Are already heavily exposed to risk assets and need your fixed-income sleeve to genuinely reduce volatility
- Cannot tolerate currency mark-to-market swings (this particularly applies to EMLC)
Our Verdict: Best EM Bond ETF for 2026
For most long-term investors, EMB is the default choice. Its $14.6 billion in AUM, 616-holding diversification, 6.09% yield, and 0.39% expense ratio make it the most complete package. The USD denomination removes currency risk from the equation, letting you express a simple view: “I want EM sovereign credit premium without the dollar bet.”
PCY is hard to recommend at a 0.50% expense ratio relative to its peers. Its concentrated portfolio could produce outsize gains — as it has YTD in 2026 — but the fee drag and lower AUM (tighter liquidity, wider spreads during stress) make it a weaker structural choice for a core EM bond allocation.
EMLC makes sense as a tactical addition — not a core holding — for investors who have a specific view that the dollar will weaken over the next 12–18 months and who understand that they are running both EM rate risk and currency risk simultaneously. Its 0.30% expense ratio is the lowest of the three, and its local-currency exposure has historically provided strong diversification benefits during dollar-weakening cycles. Pair it with EMB in a 70/30 or 80/20 blend if you want a nuanced EM debt allocation.
If you decide EM debt is not the right fit right now, the short-duration bond strategy and our breakdown of Corporate Bonds vs. Treasuries in 2026 are worth reading next — both offer yield above money market rates with considerably less duration and credit risk. Found this useful? Bookmark it so you can revisit when the market moves.
This article is for informational purposes only and is not investment advice. Do your own research. All data cited as of September 2026; sources include iShares, ETF Database, PortfoliosLab, and Bloomberg.