
Three ticker symbols dominate nearly every dividend growth conversation right now: DGRO, SCHD, and VIG. Each tracks a different index, applies a different quality filter, and delivers a very different income profile — yet all three claim to be the smartest way to compound dividend income over time. If you’re deciding where to put fresh capital in the second half of 2026, the distinction between them matters more than most investors realize. This breakdown runs the actual numbers so you can match the right fund to your goals.
For context on why dividend growth funds are getting so much attention in 2026, see our earlier piece on why dividend stocks are finally beating the S&P 500 in 2026 — the macro rotation driving that outperformance is exactly the backdrop that makes the DGRO vs SCHD vs VIG choice consequential.

Why This Three-Way Comparison Matters Now
The Federal Reserve has held the benchmark rate in a plateau band for several quarters. That environment does two things for dividend investors: it keeps the income bar high enough that stocks have to compete harder for capital, and it rewards companies that can consistently grow their payouts rather than simply offer a fat one-time yield. Dividend growth ETFs — funds that screen for stocks with multi-year track records of raising dividends — are the cleanest vehicle for capturing that theme.
SCHD is up roughly 19% year-to-date through mid-2026, outpacing both the broad market and its two closest rivals. But raw YTD performance is only one slice of the picture. The right fund for your portfolio depends on your yield requirement, your time horizon, and how much volatility you can stomach. DGRO, SCHD, and VIG each solve those trade-offs differently.
DGRO vs SCHD vs VIG — Head-to-Head Stats
Fund Basics: Index, AUM, and Holdings
These three ETFs are built on entirely different indexes, which explains why they behave so differently despite sharing the “dividend growth” label.
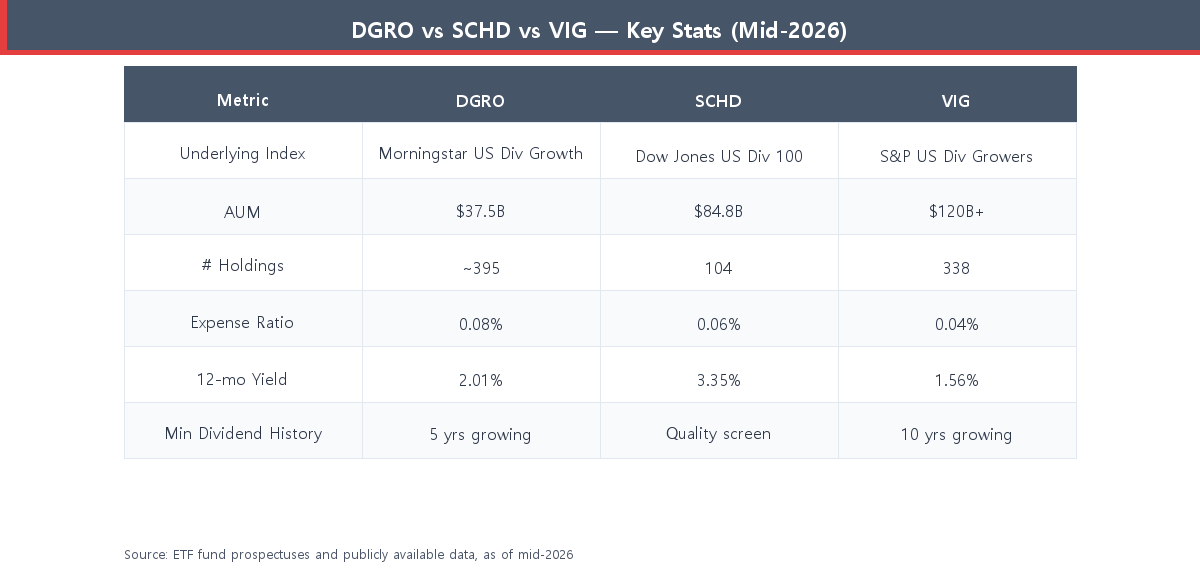
- DGRO (iShares Core Dividend Growth ETF) tracks the Morningstar US Dividend Growth Index. It screens for companies that have grown dividends for at least five consecutive years and whose payout ratio stays below 75%. The result is a broadly diversified portfolio of roughly 395 stocks with $37.5B in assets.
- SCHD (Schwab U.S. Dividend Equity ETF) tracks the Dow Jones U.S. Dividend 100 Index, which combines a dividend-history filter with fundamental quality screens — cash-flow-to-debt, return on equity, dividend yield, and dividend growth rate. Only 104 stocks make the cut from a pool of thousands, giving SCHD a concentrated, quality-first character with $84.8B in assets.
- VIG (Vanguard Dividend Appreciation ETF) tracks the S&P U.S. Dividend Growers Index. The single gatekeeping criterion is a 10-year record of consecutive dividend increases. With over $120B in assets and 338 holdings, VIG is the largest and most conservatively screened of the three.
Expense Ratios and Dividend Yields
All three funds are cheap by ETF standards, but there’s a clear spread — and on the yield side, the gap is even wider. VIG charges just 0.04% annually, making it one of the lowest-cost equity ETFs available. SCHD sits at 0.06% and DGRO at 0.08%; both remain well below the category average. The real divergence is income: SCHD’s trailing 12-month yield of 3.35% is more than double VIG’s 1.56%, with DGRO’s 2.01% landing in between. (Source: fund prospectuses and ETF data, as of mid-2026.)
For a wider look at income-oriented options beyond these three, the best high-yield dividend ETFs for 2026 covers JEPI, VYM, and other alternatives that prioritize raw yield over dividend growth consistency.
How Each Index Screens Its Stocks
Understanding the screening logic explains most of the performance and sector differences you’ll encounter:
- DGRO uses a relatively low bar (5 years of growth) but hard-caps the payout ratio, which filters out dividend traps and captures more growth-oriented companies. Tech is a larger weight here than in the other two.
- SCHD layers quality metrics on top of the dividend history screen. High cash generation, reasonable debt levels, and strong relative yield all matter. This produces a fund with heavier tilts toward consumer staples, financials, and healthcare — sectors with proven dividend reliability.
- VIG demands the longest track record (10 years) but applies no fundamental quality overlay beyond that. The longer streak requirement naturally excludes younger tech companies while concentrating holdings in large-cap stalwarts like Microsoft, Apple, UnitedHealth Group, and Visa.
5-Year Total Return: The Numbers That Actually Matter
Yield tells you what you’re getting paid today. Total return — price appreciation plus reinvested dividends — tells you how much wealth you actually built. Over the five years ending mid-2026, SCHD leads the three-way comparison with an estimated total return of approximately 74.1%, followed by DGRO at 67.3% and VIG at 65.5%. (Source: publicly available ETF data, mid-2026.)
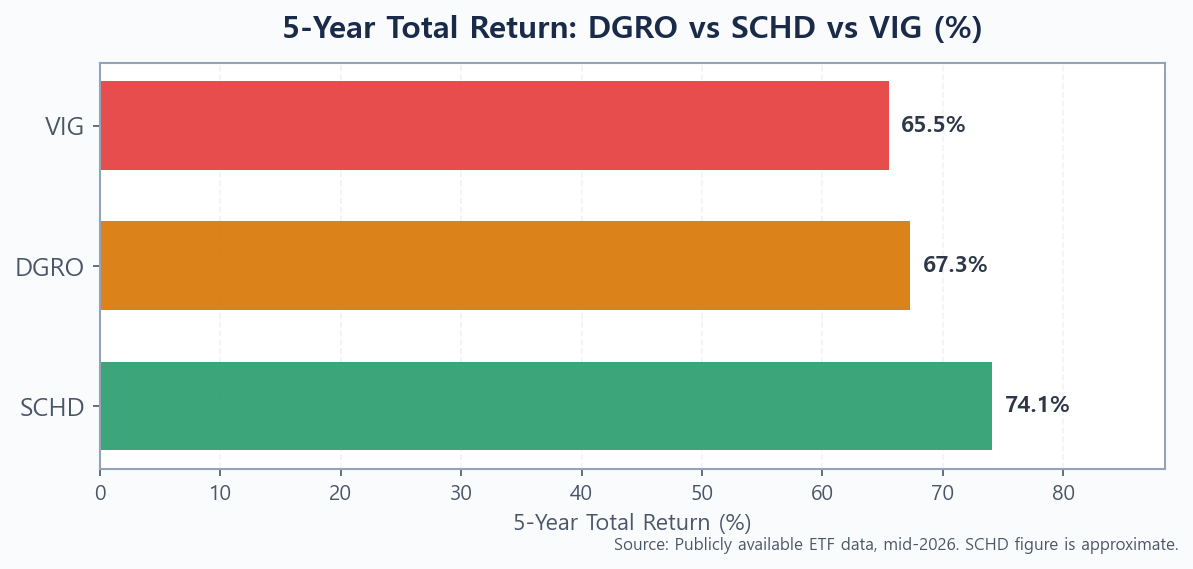
On a one-year basis, DGRO posted roughly 20% versus VIG’s 16.6%, with SCHD leading on a YTD basis. The longer pattern suggests all three have delivered competitive total returns — the differences are meaningful but none of the three is dramatically superior over a full market cycle. What separates them is the income profile attached to those returns, and that’s where your personal situation becomes decisive.
The video below breaks down the Q2 2026 performance data across the key dividend ETFs, including a close look at how DGRO, SCHD, and VIG have behaved during the recent rate plateau.
Which ETF Should You Buy in H2 2026?
Choose SCHD — Best for High Current Income
SCHD makes the most sense if you need meaningful cash flow from your dividend portfolio today. A 3.35% yield on a $100,000 position generates about $3,350 annually — roughly twice what VIG delivers and 65% more than DGRO. The quality screens embedded in the Dow Jones Dividend 100 methodology have historically produced resilient payouts even during market stress. If you’re in or near retirement and you want a single dividend-growth fund that balances income, quality, and reasonable fees, SCHD has the strongest case in H2 2026.
Choose DGRO — Best for Broad Dividend Growth Exposure
DGRO works best for investors who want diversified exposure across nearly 400 dividend-growing companies without over-concentrating in any sector or style. The lower yield (2.01%) is offset by a higher proportion of growth-oriented companies — particularly in technology — that are still in the early stages of their dividend-growth trajectory. Over the last year, DGRO’s 20% return beat VIG’s 16.6%, partly because that tech tilt paid off in the current environment. If you’re building a dividend growth core that you won’t touch for a decade, DGRO’s broad diversification reduces the risk of any single sector dominating your outcomes.
Choose VIG — Best for Long-Term Stability
VIG’s 10-year dividend streak requirement is the strictest filter in this group. Companies that have raised their dividends for a decade through multiple economic cycles — including 2008–2009, 2020, and the rate shock of 2022–2023 — have demonstrated a structural commitment to rewarding shareholders. VIG’s lower volatility and $120B+ in assets make it one of the most liquid and institutionally held dividend ETFs on the market. The trade-off is the lowest yield (1.56%) and the most conservative return profile. If capital preservation and dividend consistency matter more to you than maximizing current income, VIG fits that mandate cleanly.
For a deeper comparison between just SCHD and VIG, the SCHD vs VIG deep dive covers their sector weights, correlation to the S&P 500, and historical drawdown behavior in more detail.
The Case for Holding All Three
Many experienced dividend investors don’t choose — they hold all three in weighted proportions. A 50% SCHD / 30% DGRO / 20% VIG blend, for example, captures SCHD’s income engine, DGRO’s diversification, and VIG’s defensiveness, while producing a blended yield of around 2.6% with meaningful dividend-growth characteristics across the whole portfolio. This approach also smooths out sector concentration risk that comes with holding any single fund at high weight.
How to Maximize Your Dividend Growth Portfolio
Choosing the right ETF is only part of the equation. Three structural decisions compound your results significantly over time:
- Enable DRIP. Automatically reinvesting dividends back into additional shares turns your quarterly payouts into fractional shares that generate their own dividends in the next cycle. Over 20–30 years, a DRIP (dividend reinvestment plan) can account for more than half of total portfolio value in a dividend-growth strategy.
- Be strategic about timing new contributions. If you’re deciding between adding a lump sum today or spreading contributions over several months, the evidence tilts toward investing sooner — though the answer depends on your psychology. Our analysis of dollar-cost averaging vs lump-sum investing covers the data in full.
- Watch the compounding cost of fees. The difference between DGRO’s 0.08% and VIG’s 0.04% looks tiny in isolation. Across a 30-year holding period on a $100,000 position, even small fee differences compound into thousands of dollars in lost returns. Our primer on ETF expense ratios has the exact calculations.
The Verdict — Our Pick for H2 2026
For investors prioritizing income with quality guardrails, SCHD remains the most balanced choice in H2 2026 — its yield is meaningfully higher, its five-year total return leads the group, and the quality-screen methodology has held up well across different rate environments. If you’re comfortable with lower current yield in exchange for maximum diversification, DGRO is the strongest complement to SCHD. VIG makes the most sense as a low-volatility anchor for conservative or near-retirement portfolios.
If you’re comparing DGRO, SCHD, and VIG to higher-yield options like SPYD or VYM, the SPYD vs VYM vs SCHD comparison is worth reading as a counterpoint — those funds prioritize yield over dividend growth consistency, which suits a different investor profile entirely.
Found this useful? Bookmark it so you can revisit when the market moves. I publish practical investing breakdowns regularly — check back soon.
This article is for informational purposes only and is not investment advice. Do your own research. All figures cited are approximate and sourced from publicly available ETF data as of mid-2026. Past performance does not guarantee future results.