
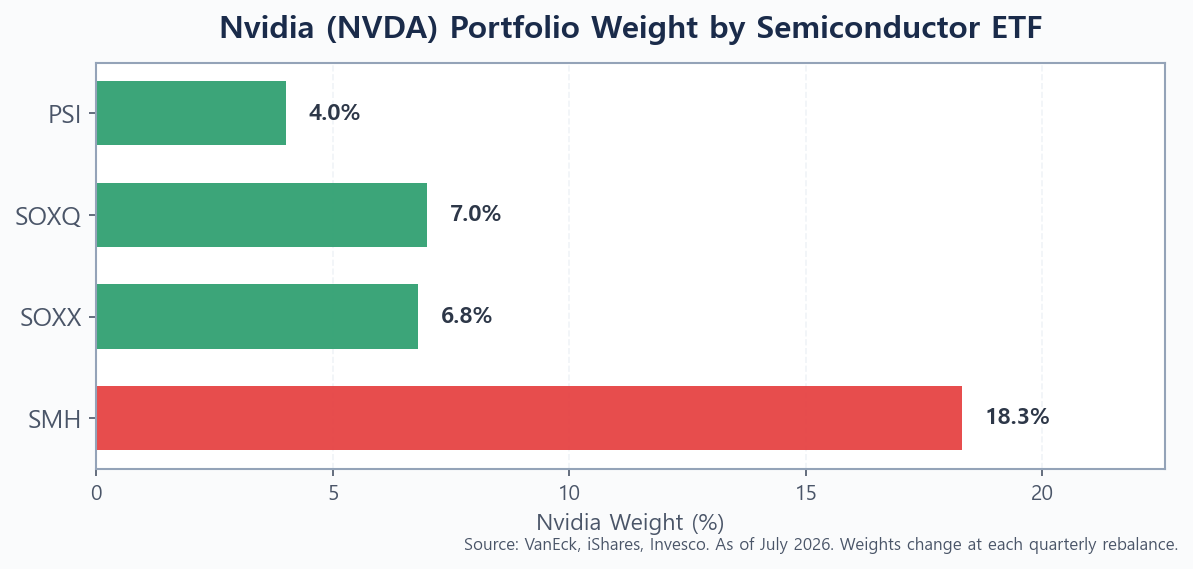
Nvidia is the defining stock of the AI era — but leaning too heavily on a single name carries real concentration risk, and the market reminded investors of that fact in the first half of 2026. The VanEck Semiconductor ETF (SMH), the largest semiconductor ETF by assets, held roughly 18% of its portfolio in Nvidia alone. Meanwhile, iShares SOXX — with a strict 8% single-stock cap — outperformed SMH by more than 30 percentage points over the same six months, simply because the AI spending cycle broadened beyond GPU purchases to equipment makers, memory producers, and foundries. If you want to stay long semiconductors in 2026 without hinging your outcome on one company, four ETFs offer four genuinely different paths: SMH, SOXX, SOXQ, and PSI. This guide explains each one so you can choose with confidence.
The semiconductor sector returned extraordinary gains in H1 2026, but the biggest winners were not always where investors expected. Understanding the structural differences between these four funds is essential before you allocate.
Why Nvidia Concentration Is a Risk Worth Addressing
Nvidia’s moat in AI accelerators remains formidable. Its H100 and Blackwell GPU architecture power the vast majority of large-scale AI training workloads, and the company’s software ecosystem (CUDA) creates switching costs that hardware competitors have not cracked. This is not an argument against owning Nvidia. It is an argument about portfolio construction.
When a single stock sits at 18% of a 25-stock fund, a 20% drawdown in that name alone costs the fund approximately 3.6 percentage points — before any other holdings move. Nvidia was up only about 5% year-to-date through June 2026, while companies like Lam Research, Applied Materials, and KLA posted triple-digit gains as semiconductor equipment orders surged alongside new AI fab construction. SMH held those names too, but with far lower weight. Funds with stricter concentration limits captured dramatically more of that broadening rally.
The 2023–2024 environment, when Nvidia led the entire chip index higher by multiples, made concentration look like pure genius. The 2026 environment — where the picks-and-shovels equipment names outperformed the GPU giant — showed the other side. Both outcomes are plausible at different points in the semiconductor cycle, which is precisely why spreading risk across the value chain has structural merit.
If you are also managing broader AI exposure across your total portfolio, see our full analysis: How to Protect Your Portfolio From an AI Bubble (2026).
The Four Semiconductor ETFs Compared: SMH, SOXX, SOXQ, and PSI
SMH (VanEck Semiconductor ETF) — The Megacap Bet
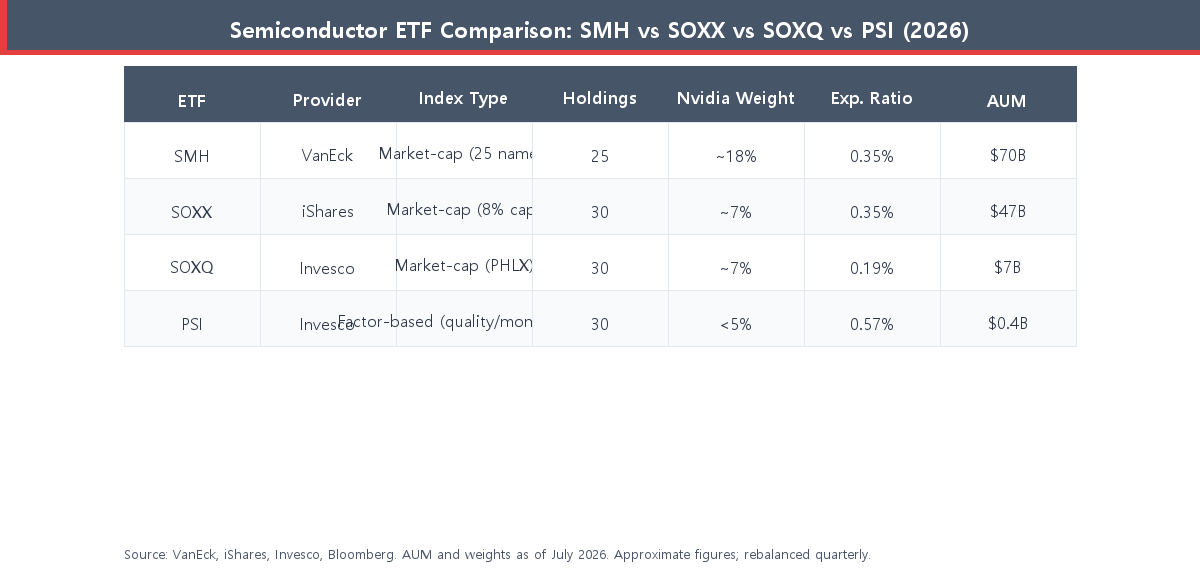
SMH tracks the MVIS US Listed Semiconductor 25 Index, a market-cap-weighted index of the 25 largest US-listed semiconductor companies. It is the largest and most liquid semiconductor ETF available, with approximately $70 billion in assets under management and average daily trading volumes that make it the operational choice for large institutional positions and active traders.
The trade-off is concentration. The 25-stock universe and market-cap weighting mean the top five holdings — Nvidia, TSMC, Broadcom, ASML, and AMD — account for well over half of net assets. Nvidia alone sits near 18%. SMH also carries meaningful international exposure through TSMC (Taiwan) and ASML (Netherlands), which distinguishes it from the more US-centric construction of SOXX and SOXQ. Expense ratio: 0.35%.
SMH is the right choice if you believe the next leg of the semiconductor rally will be led by the largest design names and foundry giants, and if daily liquidity matters for your position size or trading frequency.
SOXX (iShares Semiconductor ETF) — The Balanced Approach
SOXX tracks the ICE Semiconductor Index, which applies an 8% single-stock weight cap at every quarterly rebalance. That structural feature is what limited Nvidia to roughly 7% of the portfolio even as the stock commanded 20%+ of the sector’s total market cap — and it is the primary reason SOXX returned approximately +113% in H1 2026 versus SMH’s +82%.
With 30 holdings and approximately $47 billion in assets, SOXX gives comparatively higher weight to semiconductor equipment companies (Applied Materials, Lam Research, KLA) and memory producers (Micron) than SMH does. For investors who want full-cycle semiconductor exposure spanning design, equipment, foundry, and memory — without outsized dependence on any single name — SOXX’s construction offers a sensible and well-diversified answer. Expense ratio: 0.35%.
SOXQ (Invesco PHLX Semiconductor ETF) — The Low-Cost Alternative
SOXQ tracks the PHLX Semiconductor Sector Index — the same benchmark SOXX itself used until 2021, when iShares switched to the ICE index. In practice, SOXQ and SOXX hold very similar portfolios with near-identical performance characteristics. The critical differentiator is cost: SOXQ charges just 0.19% per year, versus 0.35% for SOXX. Over a 10-year horizon, that 16-basis-point gap compounds to meaningful additional return for buy-and-hold investors.
The trade-off is size and liquidity. SOXQ’s AUM sits near $7 billion, giving it lower daily volume and slightly wider bid-ask spreads than SOXX. For long-term investors making periodic contributions and not actively trading, SOXQ is the most cost-efficient vehicle for broad semiconductor sector exposure. For investors placing large single orders or trading tactically, SOXX’s deeper liquidity may justify the higher fee.
PSI (Invesco Semiconductors ETF) — The Factor Tilt
PSI takes the most differentiated approach in this group. It tracks the Dynamic Semiconductor Intellidex Index, a rules-based quantitative model that scores semiconductor stocks on four factors: price momentum, earnings quality, revenue growth, and management effectiveness. The result is a portfolio that actively tilts away from the largest megacap names and toward quality mid-cap chipmakers, equipment specialists, and high-quality memory producers with improving fundamentals.
Nvidia typically sits below 5% of the portfolio in PSI, and the fund reconstitutes quarterly as factor scores change. PSI’s expense ratio is higher at 0.57%, reflecting the additional methodology complexity. Its AUM is smaller at approximately $0.4 billion, so liquidity is thinner than the other three. PSI suits investors who believe factor-based selection — rotating into quality and momentum leaders within the semiconductor space — can outperform pure index weighting over a full market cycle.
For deeper context on how individual stock selection compares to ETF ownership in this space, see: Best AI-Themed ETFs for 2026: QQQ vs SOXX vs BOTZ vs Individual Stocks.
2026 Performance: What the Numbers Tell You
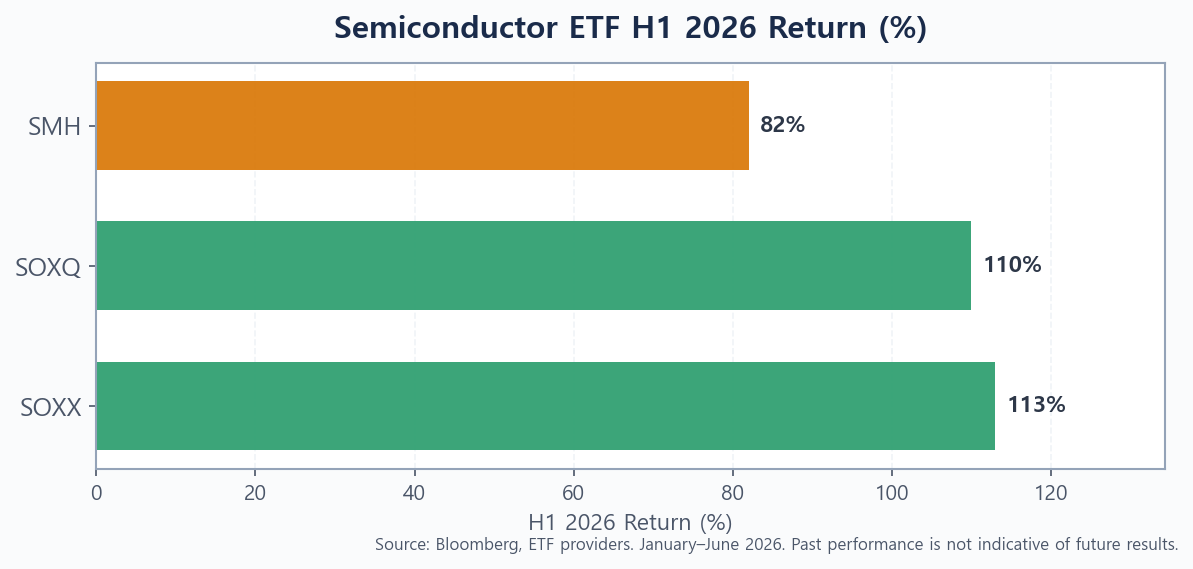
The H1 2026 scoreboard was striking. SMH returned approximately +82% through the first six months of the year — an extraordinary result by almost any historical standard. SOXX returned approximately +113% over the same period, and SOXQ — tracking a near-identical benchmark at lower cost — delivered a similar result near +110%. PSI’s factor-based construction produced a different return profile, with mid-cycle chipmakers and equipment names driving variable contribution.
The SOXX-vs-SMH performance gap traces almost entirely to the Nvidia effect in reverse. Nvidia itself gained roughly 5% year-to-date through June 2026, while semiconductor capital equipment names surged triple digits. Applied Materials, Lam Research, and KLA all benefited from the surge in AI-driven fab expansion globally, as hyperscalers poured capital into new chip manufacturing capacity. SOXX’s 8% cap meant those names carried far more weight in its portfolio than in SMH’s top-heavy structure.
The video below provides a clear breakdown of how each fund’s structure played out in 2026’s semiconductor rally:
It is essential to note that this dynamic does not always hold. In 2023 and 2024, when Nvidia stock rose by multiples on AI GPU demand, SMH’s concentration in Nvidia was a tailwind. A fund’s structural properties create permanent tilts — whether they are tailwinds or headwinds depends on which part of the semiconductor cycle is leading at any given moment.
The Semiconductor Value Chain — Beyond Just Chip Designers
One of the most useful frameworks for evaluating semiconductor ETFs is understanding the four distinct segments of the chip value chain and recognizing where each fund is concentrated:
- Design (fabless): Companies that design chips but outsource manufacturing — Nvidia, AMD, Qualcomm, Marvell, Broadcom. These names dominate SMH and make up a significant share of all four funds.
- Foundry / Manufacturing: Companies that physically fabricate chips at scale — TSMC and, to a lesser extent, Samsung. TSMC appears in all four ETFs but carries the most weight in SMH.
- Equipment: The companies that build the machines foundries need — ASML (extreme ultraviolet lithography), Applied Materials, Lam Research, KLA (etch, deposition, inspection). These benefit from every new fab expansion anywhere in the world. SOXX and SOXQ are more heavily weighted here than SMH.
- Memory: DRAM and NAND producers — Micron, SK Hynix. Memory is essential infrastructure for AI servers and consumer electronics. PSI can rotate into memory names when their factor scores improve.
Choosing between these ETFs is, in large part, choosing which segment of this chain you want most exposure to. A broad-market semiconductor cycle — like 2026’s — rewards full-chain exposure. An AI-led GPU supercycle — like 2023’s — rewards concentration in design names. Neither environment is permanent.
For a deeper dive into the two largest individual stocks within the design and foundry segments, see: NVIDIA vs TSMC: Which AI Chip Stock Is the Smarter Long-Term Buy in 2026?
How to Choose the Right Semiconductor ETF for Your Portfolio
There is no universally superior option. The right choice depends on your investment thesis, holding period, position size, and how much you care about cost minimization versus factor tilts. Use this framework:
- Choose SMH if you want maximum liquidity for large positions or frequent trading, you hold a view that the largest AI chip designers (Nvidia, Broadcom, TSMC) will lead the next leg of the rally, and tight bid-ask spreads matter.
- Choose SOXX if you want broad full-cycle semiconductor exposure with moderate Nvidia concentration, you value higher equipment-maker weight, and you are comfortable paying 0.35% for SOXX’s brand recognition and deep secondary market.
- Choose SOXQ if you want near-identical exposure to SOXX but at 0.19% annual cost, you are a buy-and-hold investor, and you do not need the daily liquidity that SOXX’s larger AUM provides.
- Choose PSI if you want a factor-driven rotation within semiconductors, you trust quantitative quality and momentum signals to identify cycle leaders, and you are comfortable with higher turnover, higher expense ratio (0.57%), and thinner liquidity.
There is also no rule that limits you to one. A common sensible approach is a core SOXQ position for low-cost broad exposure, with a smaller PSI allocation to capture factor-driven rotations that a market-cap index would miss. Think of the combination the same way you might think about equal-weight versus market-cap construction: Equal-Weight vs Market-Cap ETF in 2026 (VOO vs RSP) explores that tradeoff in the broader S&P 500 context.
Conclusion
The first half of 2026 made a clear empirical case for spreading risk across the semiconductor value chain. SOXX’s 8% concentration cap allowed it to capture the equipment-maker surge that SMH’s market-cap weighting partially missed. SOXQ delivered nearly the same result at meaningfully lower cost. PSI offered a third path entirely — factor-based rotation independent of market-cap size signals. None of these outcomes was guaranteed in advance, and none of them will necessarily repeat.
What does not change is the structural argument: the semiconductor sector spans designers, foundries, equipment makers, and memory producers, and different segments lead at different stages of the investment cycle. Holding an ETF that spreads exposure across that full chain — rather than concentrating at the top by market cap — gives your portfolio more ways to win as the cycle rotates. For most long-term investors, SOXX or SOXQ represents the most balanced entry point. SMH suits traders and those with a concentrated AI-chip thesis. PSI suits factor-oriented investors willing to accept higher costs and turnover for a quality-momentum tilt.
Found this useful? Bookmark it so you can revisit when the market moves. I publish practical investing breakdowns regularly — check back soon.
This article is for informational purposes only and is not investment advice. Do your own research before making any investment decisions. Past performance is not indicative of future results.