
Two high-dividend ETFs dominate the conversation for income-focused investors: iShares Core High Dividend ETF (HDV) and Vanguard High Dividend Yield ETF (VYM). Both hold US dividend-paying stocks, yet they take very different approaches to picking them. HDV concentrates on 75 financially screened companies with higher yields; VYM casts a wider net across 608 stocks at the lowest cost in its category. If you are trying to decide between the two, this head-to-head comparison breaks down every metric that matters.

What Are HDV and VYM — and How Do They Pick Stocks?
On the surface, HDV and VYM chase the same goal: own US companies that pay above-average dividends. Underneath, their stock-selection methodologies are quite different — and those differences shape everything from yield to sector exposure to downside behavior.
HDV: Quality Screening Through Morningstar’s Dividend Focus Index
HDV tracks the Morningstar Dividend Yield Focus Index. The index starts by requiring companies to have an “economic moat” — a durable competitive advantage, in Morningstar’s definition — then screens out those with weak credit quality using Morningstar’s proprietary metrics. Only the top 75 highest-yielding stocks that pass both filters make the cut.
This two-step screen produces a compact, defensive portfolio. ExxonMobil (7.3%), AbbVie (6.32%), and Chevron (5.7%) sit at the top (Source: iShares Fact Sheet, as of June 30, 2026). Energy and healthcare giants dominate because they tend to generate stable cash flows and pay large, consistent dividends — exactly what Morningstar’s quality screen rewards.
VYM: Broad High-Yield Coverage Through the FTSE Index
VYM tracks the FTSE High Dividend Yield Index, which takes a simpler approach: rank all dividend-paying US stocks by forecast yield, exclude REITs, and own the higher-yielding half. No moat requirement. No credit screen. The result is a portfolio of roughly 608 stocks (Source: Vanguard, as of June 2026) that looks much more like the broad market.
VYM’s top holding is Broadcom at 8.0%, followed by JPMorgan Chase (3.3%) and ExxonMobil (2.7%). The fund holds significant technology and financial services exposure — sectors that rarely appear in more defensively oriented dividend ETFs like HDV.
Head-to-Head: Yield, Fees, Holdings, and 5-Year Performance
The table below captures the core trade-off between HDV and VYM. HDV delivers higher income; VYM delivers lower cost and broader diversification. Over five years, their total returns are nearly identical — which makes the choice more about portfolio role than raw performance.
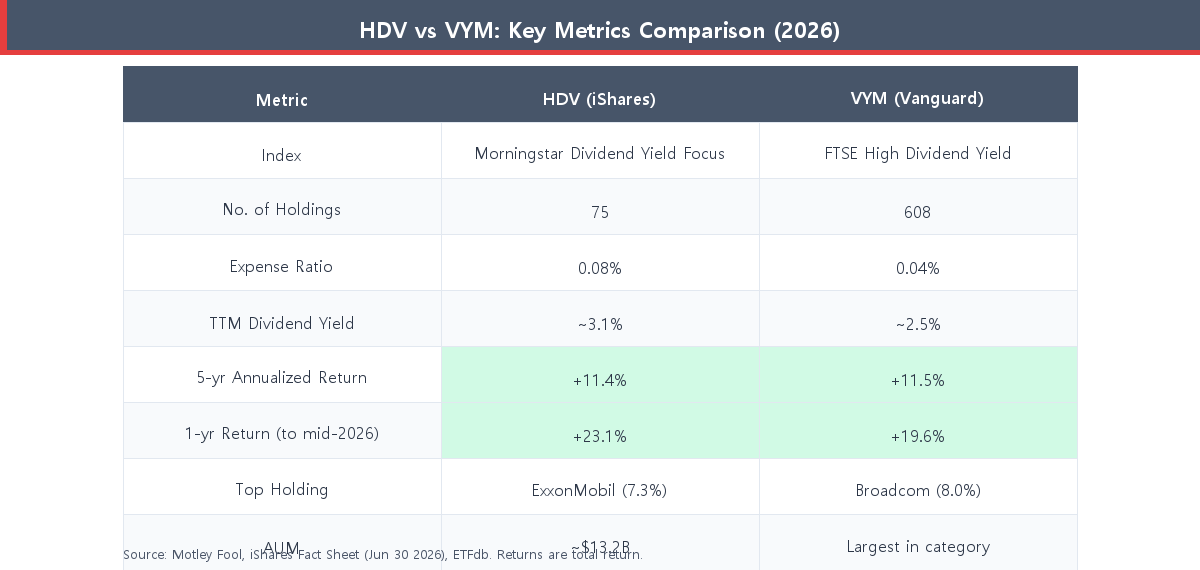
HDV’s 1-year return of +23.1% is notably stronger than VYM’s +19.6% (through mid-2026), a gap that reflects HDV’s heavy energy and healthcare weighting in a year when those sectors outperformed (Source: Motley Fool, July 2026). Over five years, however, VYM’s annualized +11.5% barely edges HDV’s +11.4%, confirming that neither fund has a durable performance edge over a full cycle.
The expense ratio gap — 0.04% for VYM versus 0.08% for HDV — seems small, but on a $100,000 portfolio it compounds to a difference of roughly $40 per year and thousands of dollars over a decade. For a buy-and-hold income investor, that matters.
Want to see how HDV and VYM stack up against a third high-yield option? Read our full three-way breakdown: SPYD vs VYM vs SCHD: Best High-Dividend ETF for 2026?
Sector Breakdown: Where HDV and VYM Diverge Most
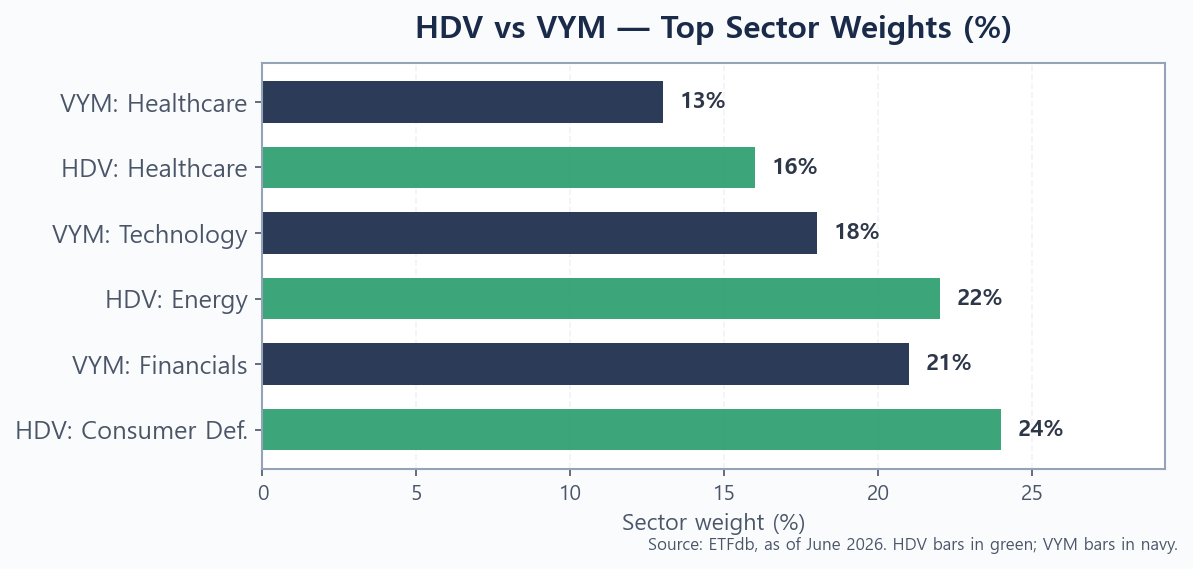
Sector allocation is where HDV and VYM look most different from each other — and where the real investment decision lives. HDV is defensively concentrated: Consumer Defensive (24%), Energy (22%), and Healthcare (16%) make up more than 60% of the fund. These sectors tend to hold up better during recessions and market drawdowns, but they also lag during risk-on rallies (Source: ETFdb, as of June 2026).
VYM, by contrast, tilts toward Financial Services (21%) and Technology (18%), while Healthcare comes in at a smaller 13%. That tech weighting — unusual for a dividend fund — is driven largely by Broadcom, which became a dominant position after its elevated dividend qualified it for FTSE’s index. The financial services overweight gives VYM more sensitivity to interest rate movements, for better or worse.
The video below covers VYM alongside several other dividend ETFs and explains how sector concentration affects long-term total return — a useful deeper dive if you want the full picture before deciding.
Note that HDV’s defensive tilt makes it behave more like a bond-substitute in downturns. If rising Fed rates are a concern for your dividend income, the article Fed Rates & Dividend Stocks: Protect Your Income (2026) explains which sectors are most exposed.
HDV vs VYM in 2026: Which One Should You Choose?
Neither ETF is universally better. The right choice depends on what role the fund will play in your portfolio and how much income versus diversification you need.
Choose HDV If You Want Higher Yield and Defensive Stability
HDV’s ~3.1% TTM yield is meaningfully higher than VYM’s ~2.5%. That extra income matters for retirees or anyone living off portfolio distributions. The Morningstar quality screen also means HDV holds only companies with durable business models — a meaningful safeguard against dividend cuts. If you want a concentrated, defensive income stream and are comfortable with energy and healthcare sector risk, HDV is the stronger income play.
The trade-off is concentration. Seventy-five holdings is thin, and the top-three positions — Exxon, AbbVie, Chevron — represent nearly 20% of the fund. A single bad year for energy or pharma can drag the entire fund.
Choose VYM If You Want Broad Diversification and Lower Fees
VYM’s 608 holdings give you exposure across virtually every income-producing corner of the US market. Its 0.04% expense ratio is among the lowest available anywhere in equity ETFs. The inclusion of financials and technology makes it behave more like a broad market tilt rather than a defensive income play — which also means better upside participation when growth sectors run.
If you are building a core dividend holding and want a fund that closely tracks broad market returns while delivering above-average yield, VYM fits that role well. (If dividend growth — not current yield — is your priority, consider a different angle: SCHD vs VIG: Best Dividend Growth ETF for 2026?)
For a broader look at top income options — including SCHD and JEPI — see our roundup: Best High-Yield Dividend ETFs for 2026.
Can You Hold Both?
Yes — and it can make sense. HDV and VYM complement each other: HDV adds yield and defensive concentration; VYM adds breadth, lower fees, and sector balance. A 50/50 blend blends the two strategies without fully committing to either. That said, the overlap in energy and healthcare means you are not diversifying as much as the different stock counts suggest.
For investors curious whether dividend stocks as a category belong in a growth-tilted portfolio at all, the broader data is compelling in 2026: Why Dividend Stocks Beat the S&P 500 in 2026 covers the macro shift driving dividend outperformance this year.
The Bottom Line
HDV and VYM are both solid, low-cost dividend ETFs — but they serve different investors. HDV is the better choice for pure income seekers who value quality screening and a higher yield, and who can stomach sector concentration in energy and consumer staples. VYM is the better choice for investors who want broad market exposure with a dividend tilt at the lowest possible cost.
Over a five-year horizon, their total returns have been nearly indistinguishable. The decision ultimately comes down to yield versus diversification, and how much sector concentration you are comfortable holding. If you want to compare the dividend-growth alternatives — ETFs that prioritize payout growth over current yield — start with DGRO vs SCHD vs VIG: Best Dividend Growth ETF to Buy in H2 2026.
Found this useful? Bookmark it — dividend ETF data shifts quarterly, and it is worth revisiting when the next round of yield updates comes in.
This article is for informational purposes only and is not investment advice. Do your own research before making any investment decision.