
Three ETFs. Trillions in combined assets. And yet most investors spend more time debating them than any other choice in their portfolio. If you’re building a long-term portfolio and trying to decide between BND, AGG, and BNDX as your core bond holding — especially now that the 10-year Treasury yield is hovering above 5% — this breakdown gives you the verdict without the fluff.
Why the 10-Year Above 5% Changes the Bond ETF Math
Before comparing the three funds, it’s worth understanding why the 5% threshold matters. When the 10-year Treasury yield sits above 5%, the calculus for total bond funds shifts meaningfully — both in terms of risk and opportunity.
Duration Risk Bites Harder at Higher Yields
BND and AGG each carry a duration of roughly 5.7–5.8 years. That means for every 1 percentage point rise in yields, these funds would lose approximately 5.7–5.8% in price. At the 2020 low-rate environment (10-year at 0.5%), that risk was abstract. At 5%+, the yield can realistically climb further — to 5.5% or even 6% — before mean-reverting. A 50 basis point move from here would cost you roughly 2.9% in price. That’s a real number worth acknowledging.
For a deeper look at how the yield curve is behaving right now, see our overview of the Treasury Yield Curve Steepening in 2026 and what it means for bond positions.
Why a 5%+ 10-Year Resets the Risk/Reward Case for Total Bond Funds
Here’s the flip side: higher starting yields compress the break-even period. If yields rise another 50 basis points, you absorb roughly a 2.9% price loss — but you also immediately begin earning a higher coupon. At a 4.60% annual yield, you recover that price loss in under nine months of income alone. Compare that to 2021, when BND’s yield was 1.8% — a 50 basis point loss would have taken years to offset. For long-term investors (10+ years), buying BND or AGG with a 4.6% starting yield is a very different proposition than buying either at 2%.
For a detailed breakdown of the current rate environment, our post on the 10-Year Treasury Yield Outlook 2026 covers where forecasters see yields heading.
BND vs. AGG vs. BNDX — Key Stats at a Glance (2026)
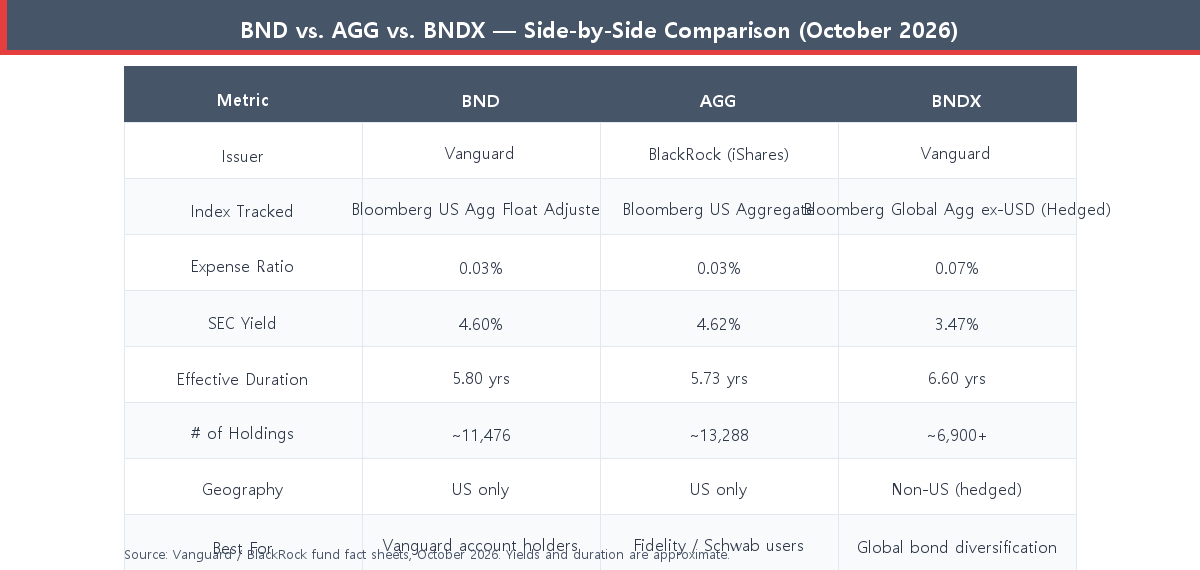
The table below compares the three funds across the metrics that actually matter for a long-term holder. Data as of October 2026.
BND (Vanguard Total Bond Market ETF) — The Case For and Against
BND is Vanguard’s flagship bond ETF, tracking the Bloomberg U.S. Aggregate Float Adjusted Index. With over $120 billion in assets and an expense ratio of 0.03%, it’s one of the cheapest and most widely held bond funds in the world.
What BND Actually Holds
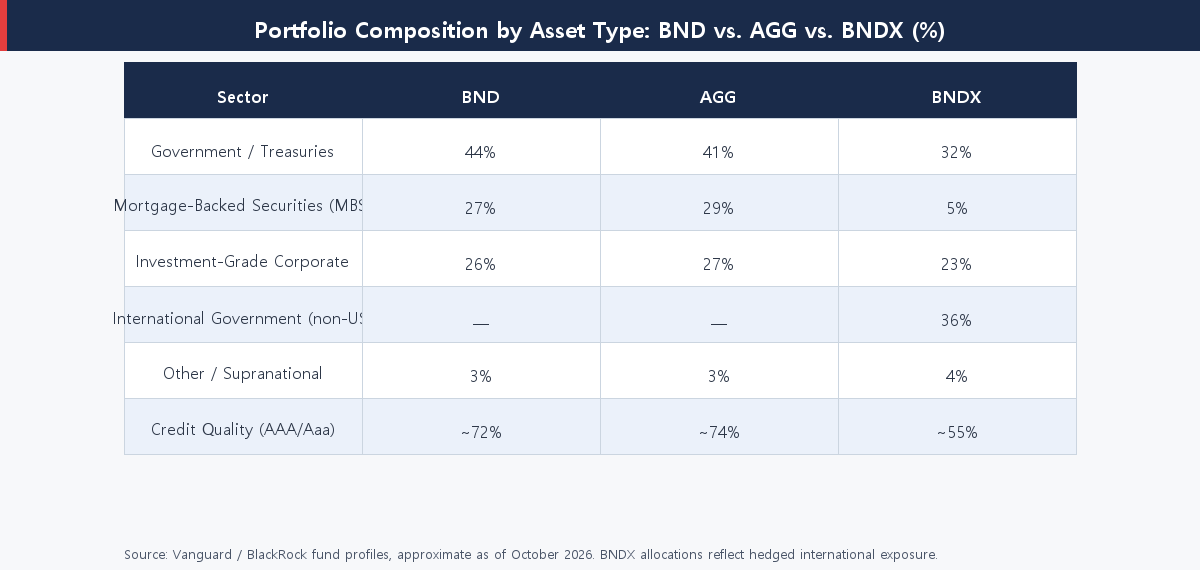
BND currently holds approximately 11,476 bonds. The portfolio breaks down roughly as follows: around 44% in US Treasuries and agency securities, 27% in mortgage-backed securities (MBS), 26% in investment-grade corporate bonds, and the remainder in other investment-grade instruments. All holdings must be US dollar-denominated, investment-grade, and have at least one year to maturity. The “Float Adjusted” in the index name means it excludes bonds held in Federal Reserve SOMA accounts — a distinction that doesn’t affect most investors meaningfully but results in slightly different composition versus AGG.
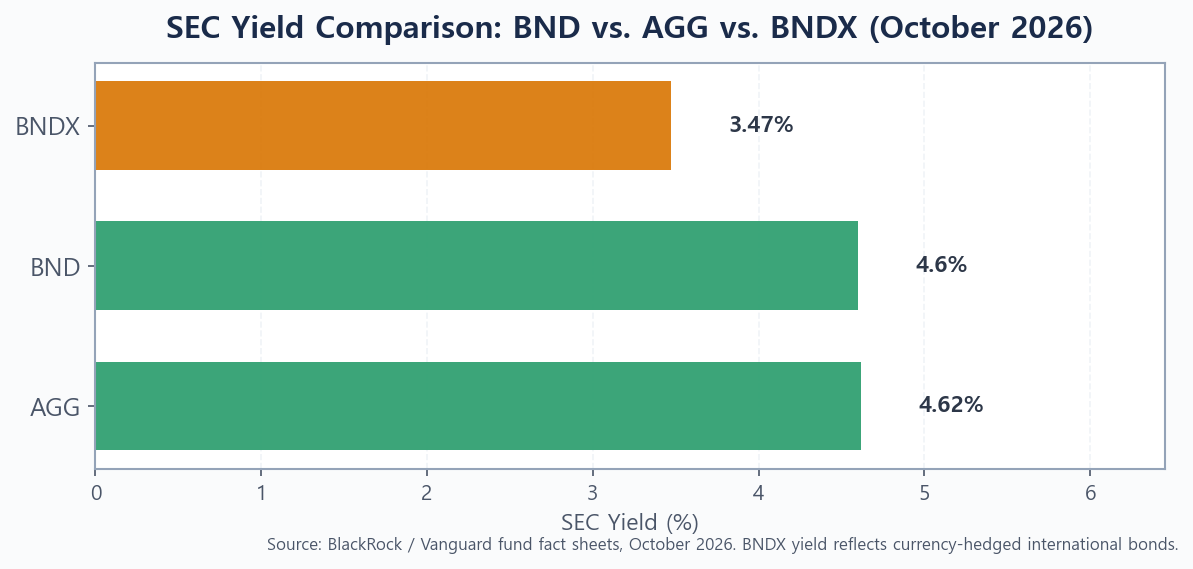
BND’s current SEC yield is approximately 4.60% and its effective duration is 5.80 years. (Source: Vanguard, as of October 2026.)
BND’s Edge: Seamless Integration in Vanguard Accounts
If you invest through Vanguard, BND has one structural advantage that’s easy to overlook: you can access the identical portfolio through the mutual fund share class VBTLX. Mutual fund shares automatically reinvest dividends at NAV, with no bid-ask spread. This matters less for large accounts, but for monthly DCA (dollar-cost averaging) contributions, frictionless reinvestment adds up. Outside of Vanguard, this edge largely disappears.
AGG (iShares Core U.S. Aggregate Bond ETF) — The Case For and Against
AGG is BlackRock’s answer to BND, tracking the Bloomberg U.S. Aggregate Bond Index. It is virtually identical in purpose and cost, with an expense ratio of 0.03% and an AUM that rivals BND for the title of the world’s largest bond ETF.
What AGG Actually Holds
AGG holds approximately 13,288 bonds — more than BND, largely because the two indexes have slightly different construction rules. AGG allocates roughly 41% to Treasuries, 29% to agency MBS, and 27% to investment-grade corporates. Its SEC yield currently sits at approximately 4.62% and effective duration at 5.73 years — functionally the same as BND. (Source: BlackRock, as of October 2026.)
The two funds’ total return correlation is approximately 0.996, meaning they move nearly in lockstep day to day. Over long periods, their cumulative performance has differed by only a handful of basis points in either direction — never by enough to matter for a real investor’s outcome.
AGG’s Edge: Volume and Platform Availability
AGG trades significantly more shares per day than BND, which means tighter bid-ask spreads for larger block trades. For most individual investors making regular contributions, this is irrelevant. But for investors on Fidelity or Schwab who want the bond component of a simple 3-fund portfolio, AGG is the natural default — it’s commission-free everywhere, and BlackRock’s fixed-income research infrastructure provides tight index tracking.
BNDX (Vanguard Total International Bond ETF) — Is Global Diversification Worth the Trade-Off?
BNDX is where the conversation gets more nuanced. Unlike BND and AGG, BNDX holds non-US investment-grade bonds from developed and emerging market governments and corporations. Critically, all currency exposure is hedged back to US dollars, so you’re getting geographic diversification without taking on foreign exchange risk.
What BNDX Holds and Why It Yields Less
BNDX tracks the Bloomberg Global Aggregate ex-USD Float Adjusted RIC Capped Index. Its current SEC yield is approximately 3.47% — roughly 115 basis points lower than BND — because European and Japanese government bonds simply yield less than US Treasuries. Its effective duration is approximately 6.60 years, slightly longer than BND or AGG. The expense ratio is 0.07%, more than double BND/AGG, reflecting the complexity of managing cross-currency hedges across multiple markets. (Source: Vanguard, as of October 2026.)
When BNDX Makes Sense (and When to Skip It)
The academic case for BNDX rests on correlation: non-US bonds don’t move in perfect lockstep with US bonds, which can smooth portfolio volatility over a full market cycle. The popular “two-bond” allocation used by many Bogleheads pairs BND and BNDX in a roughly 70/30 split of the bond allocation, mirroring how VTI and VXUS together form a total world stock portfolio.
But at 5%+ US yields, the trade-off is hard to ignore. You’re giving up roughly 115 basis points of yield and accepting more duration risk (6.6 years vs. 5.8 years) in exchange for geographic diversification. For investors whose primary concern is income from bonds — especially those closer to or in retirement — that yield gap is real. For younger investors with a 20+ year horizon who want a truly global bond allocation, BNDX as 20–30% of the bond sleeve remains a defensible choice.
Worth reading next: our comparison of Treasury Bond Ladder vs. Bond ETF for Retirement Income breaks down when an ETF approach makes more sense than holding individual bonds directly.
Head-to-Head Verdict: BND vs. AGG vs. BNDX for Long-Term Investors
Here is the plain summary after cutting through the noise:
- BND vs. AGG: These are, for all practical purposes, the same fund. Both charge 0.03%, both yield ~4.60–4.62%, and both carry ~5.7–5.8 years of duration. Choose BND if you invest at Vanguard; choose AGG if you invest at Fidelity, Schwab, or any other broker. There is no scenario where an investor should hold both — that’s redundant diversification with no added benefit.
- BNDX: A supplementary holding, not a replacement for BND or AGG. Add it if you want geographic bond diversification and accept the yield drag. At today’s US yields above 5%, the case for BNDX as a primary holding is weaker than it was in 2019–2020 when the US/international yield gap was narrower.
- When the 10-year stays above 5%: BND and AGG both offer starting yields that are historically attractive. Long-term investors — those holding for 7 years or more — have a compelling case to add exposure at current yield levels. The short-term price volatility is real, but the income stream at 4.60%+ creates a meaningful buffer.
If you’re worried about duration risk in the current environment, our post on why short-duration bonds make sense in a high-rate world explores alternatives with less interest-rate sensitivity. And if you want to understand how corporate bonds compare to Treasuries as a complement to your core bond ETF, see our breakdown of Corporate Bonds vs. Treasuries in 2026.
How to Use These ETFs Together: The Classic Two-Fund Bond Approach
For investors who want broad global bond exposure and don’t want to pick sides, the simplest approach is:
- 70% BND (or AGG) — core US investment-grade exposure at ~4.60% yield
- 30% BNDX — international developed-market bonds for geographic diversification
This mirrors the global market-cap weighting of US vs. non-US bonds. It’s the bond equivalent of pairing VTI and VXUS for equities. The blended yield on this combination works out to approximately 4.26% — still historically competitive, though lower than a US-only allocation.
For an overview of how bond allocations fit into a broader portfolio, see our guide on how to build a simple 3-fund portfolio in 2026, which walks through stock-to-bond ratios by age and time horizon. Also worth understanding: our explainer on why ETF expense ratios matter more than most investors realize reinforces why the 0.03% vs. 0.07% difference compounds over decades.
Bottom Line
BND vs. AGG vs. BNDX is ultimately three different questions: BND vs. AGG is a brokerage question, not a strategy question — they are effectively the same fund. BNDX vs. no-BNDX is a diversification philosophy question — and at 5%+ US yields, the default tilt should lean toward the higher-yielding US option unless you have a specific reason to diversify globally. And the “is now a good time for bonds at 5%+” question has a clearer answer than it has had in a decade: for long-term holders, a 4.60% starting yield with ~6 years of duration is a reasonable place to be.
Found this useful? Bookmark it so you can revisit when yields move. I publish practical investing breakdowns regularly — check back soon.
This article is for informational purposes only and is not investment advice. Do your own research. All yield and duration figures are approximate and sourced from fund provider fact sheets as of October 2026. Bond fund prices fluctuate and past performance does not guarantee future results.