
High-yield bonds are paying roughly 7.5% right now. Investment-grade corporates are yielding about 5.5%. The gap — that extra 2% — sounds appealing, especially when cash-like Treasuries are hovering around 4.5%. But yield differences in the bond market are never free money. They exist because high-yield bonds carry a meaningfully higher chance of default. The question worth asking before you reach for that extra income is simple: does the 2% premium actually compensate for the additional default risk, or are you taking on risk you won’t be rewarded for? This guide breaks down the math and the trade-offs so you can decide for yourself. For background on how corporate bond spreads work relative to Treasuries in general, see our overview of Corporate Bonds vs. Treasuries in 2026: Worth the Risk?

Understanding the Yield Spread: What the “Extra 2%” Really Means
How Credit Spreads Are Calculated
A bond’s yield is not quoted in isolation. It is always measured as a spread — the number of extra basis points (bps) an investor demands above a “risk-free” benchmark, typically the comparable-maturity US Treasury. One basis point equals 0.01 percentage point, so a 200 bps spread means the bond yields 2.0% more than the Treasury.
Credit spreads exist because corporate bonds carry two risks Treasuries do not: the risk that the issuer will default (credit risk) and the risk that the bond will be hard to sell in a crisis (liquidity risk). Investment-grade (IG) bonds — those rated BBB/Baa or above by S&P and Moody’s — have narrow spreads because their issuers are financially strong. High-yield (HY) bonds, rated BB/Ba or below, carry wider spreads to compensate for a much higher probability of default.
2026 Snapshot: IG at ~5.5%, HY at ~7.5%
As of mid-2026, the US bond market looks like this (Source: U.S. Treasury / Bloomberg, August 2026):
- 10-year Treasury yield: ~4.5%
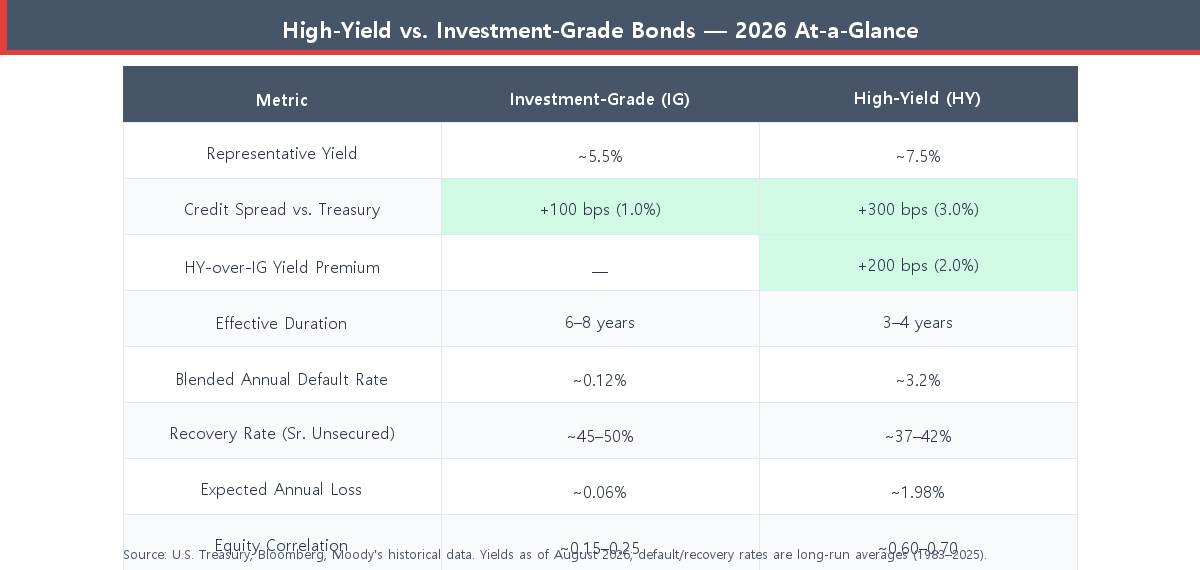
- IG corporate bond yield (e.g., Bloomberg US Corporate Index): ~5.5% — a spread of roughly +100 bps (1.0%) over Treasuries
- HY corporate bond yield (e.g., Bloomberg US High Yield Index): ~7.5% — a spread of roughly +300 bps (3.0%) over Treasuries
- HY vs. IG spread (the “extra 2%”): ~200 bps (2.0 percentage points)
It is worth noting that current HY spreads of around 300 bps are well below the long-run historical average of 400–500 bps. This matters: tight spreads mean investors are getting less incremental compensation for default risk than they would in a more typical market environment. The yield pickup is 2%, but the baseline for that extra yield is already historically compressed.
The Default Risk Behind the Extra Yield
Historical Annual Default Rates by Credit Tier
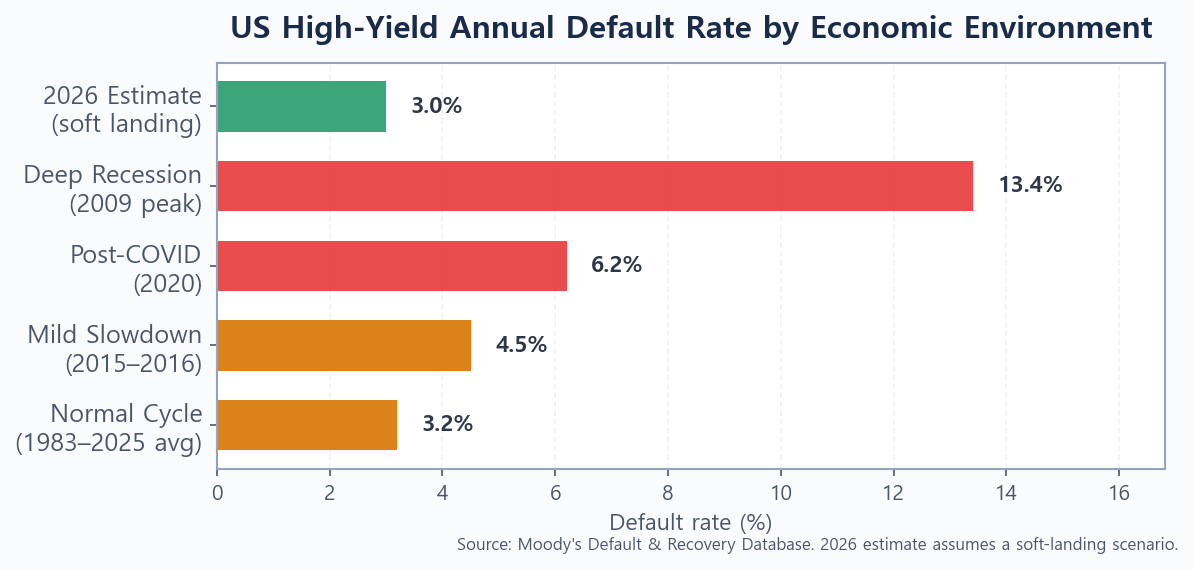
High-yield bonds default far more often than investment-grade bonds. The table below uses long-run average annual default rates from Moody’s historical data (averages for 1983–2025):
| Rating | Category | Avg. Annual Default Rate |
|---|---|---|
| AAA / AA | Investment Grade | ~0.01% |
| A | Investment Grade | ~0.06% |
| BBB | Investment Grade | ~0.20% |
| BB | High Yield | ~0.9% |
| B | High Yield | ~3.7% |
| CCC / C | High Yield | ~13.5% |
| IG blended avg. | Investment Grade | ~0.12% |
| HY blended avg. | High Yield | ~3.2% |
These are long-run averages in normal credit cycles. In recessions, HY default rates spike sharply — reaching 12–14% annually in 2009 during the financial crisis and around 6% in 2020 during the COVID shock. IG defaults remain relatively contained even in severe downturns.
Recovery Rates and Loss-Given-Default
Defaulting does not mean you lose everything. Bondholders recover some principal through bankruptcy proceedings. Historically (Source: Moody’s, 1983–2025 averages):
- IG bonds: recovery rate of ~45–50%. Loss-given-default (LGD) ≈ 53%.
- HY bonds (senior unsecured): recovery rate of ~37–42%. LGD ≈ 62%.
HY bonds recover less because defaulting companies tend to be more leveraged, leaving creditors a smaller slice of remaining assets. The combination of higher default probability and lower recovery is what the extra yield must compensate for.
Running the Math: Does the Extra Yield Cover the Extra Risk?
The Expected-Loss Formula
A simple way to evaluate whether a yield spread fairly compensates for credit risk is expected annual loss (EAL):
EAL = Default Rate × Loss-Given-Default
Plugging in the long-run averages:
- Investment-Grade EAL: 0.12% × 53% ≈ 0.06% per year
- High-Yield EAL: 3.2% × 62% ≈ 1.98% per year
- EAL difference: 1.92% — meaning HY must yield nearly 2% more just to break even on expected credit losses versus IG.
The current 2% HY-over-IG spread barely covers the expected credit-loss differential. There is almost no surplus compensation left for the liquidity risk, the volatility, and the equity-like drawdowns that HY bonds exhibit in recessions. In a historical average credit environment, the math is roughly breakeven at today’s spreads — which is not the compelling risk-reward proposition the headline yield suggests.
What 2026’s Tight Spreads Imply
The situation is made more nuanced by the current spread environment. HY spreads at ~300 bps are historically tight, which means the market is pricing in a relatively benign default outlook. That may prove correct if the US economy avoids recession. But tight spreads also create an asymmetry: there is limited room for spreads to tighten further (meaning modest capital appreciation upside), while a deterioration in credit conditions could push spreads back toward their 400–500 bps historical average — a repricing that would generate significant price losses even before a single default occurs.
This is why context matters as much as the raw yield number. For a broader view of how bond duration interacts with the current rate structure, see Why Short-Duration Bonds Win in a 4% Treasury World (2026) and Treasury Yield Curve Steepening in 2026: What It Means.
High-Yield vs. Investment-Grade ETFs: Head-to-Head Comparison
Most individual investors access corporate bonds through ETFs rather than individual bonds. Here is how the leading options compare as of August 2026 (Source: iShares / Vanguard / ETF.com, August 2026):
| ETF | Category | 30-Day SEC Yield | Expense Ratio | Effective Duration | No. of Holdings |
|---|---|---|---|---|---|
| LQD | IG Long-Term | 5.4% | 0.14% | 8.3 yrs | ~2,500 |
| VCIT | IG Intermediate | 5.3% | 0.04% | 6.2 yrs | ~2,000 |
| HYG | High-Yield Blend | 7.6% | 0.48% | 3.4 yrs | ~1,200 |
| JNK | High-Yield Blend | 7.7% | 0.40% | 3.4 yrs | ~900 |
| USHY | HY Broad Market | 7.5% | 0.08% | 3.5 yrs | ~2,000 |
Two observations stand out. First, HY ETFs have significantly shorter durations (3–4 years) than IG ETFs (6–8 years). This means HY is less sensitive to interest-rate moves — a relevant consideration when the rate environment remains uncertain. Second, HY expense ratios vary widely: USHY at 0.08% is nearly as cheap as passive IG funds, while HYG at 0.48% eats meaningfully into net yield over time. Cost matters when comparing gross yields that are already similar after expected losses.
The Plain Bagel’s recent video covers what to watch for before allocating to high-yield bond funds in detail:
One additional dimension the table does not show: equity correlation. HY bonds correlate strongly with equities (historical correlation ~0.65), whereas IG bonds, especially Treasuries-heavy variants, correlate much less (~0.15–0.25). This matters because the main reason most investors hold bonds is to dampen portfolio volatility and provide a cushion when stocks fall. In a market selloff — precisely when you need that cushion — HY bonds tend to fall alongside equities, providing little diversification benefit. IG bonds, by contrast, often hold their value or even rise as investors flee to quality.
When High-Yield Makes Sense — and When It Doesn’t
Cases where HY can be a reasonable allocation:
- You already hold a high equity allocation (70%+) and are adding bonds primarily for yield, not stability. If portfolio stabilization is not the goal, HY’s equity-like behaviour is less of a problem.
- You have a short to medium investment horizon (1–5 years). HY’s shorter duration reduces interest-rate risk relative to long IG bonds — potentially useful if you believe rates stay elevated.
- The economic outlook is clearly benign. In soft-landing or mild-growth scenarios, HY default rates stay in the 2–3% range, and the extra yield translates into a genuine (if modest) return premium.
- You use a low-cost broad fund (e.g., USHY at 0.08%) to minimise expense drag and diversify across hundreds of issuers, limiting single-issuer default impact.
Cases where IG is the better choice:
- You hold bonds for diversification and downside protection. The low equity correlation of IG bonds is the diversification benefit that matters most in a portfolio context.
- You are near or in retirement, where capital preservation is more important than maximising yield. A HY drawdown of 20–30% in a recession is a meaningful setback when you are drawing down a portfolio.
- Spreads are historically tight (as they are in 2026). When the market is not paying you much extra per unit of risk, the risk-reward tilts in IG’s favour.
- You are building a bond ladder for predictable income. IG bonds — especially Treasuries — allow for precise income planning without the uncertainty of defaults. See our comparison of Treasury Bond Ladder vs. Bond ETF for Retirement Income.
A middle path worth considering: some investors split their fixed-income allocation — e.g., 80% IG (using VCIT for low cost and moderate duration) and 20% HY (using USHY for broad exposure and low cost). This captures a portion of the yield premium while keeping the portfolio’s defensive character mostly intact. If you are reviewing how to rebalance your fixed-income exposure in the current environment, How to Rebalance Your Portfolio When Interest Rates Are Rising walks through a step-by-step framework.
Conclusion: The Extra 2% Is Fair Compensation — in the Right Conditions
High-yield bonds vs. investment-grade bonds in 2026 comes down to a precise calculation, not a simple preference. The ~2% yield premium that HY offers over IG is almost exactly accounted for by the expected credit-loss differential — 1.92% per year in expected losses, leaving roughly 0.08% of surplus premium in a normal credit cycle. That thin margin of safety disappears quickly in a recession or a spread-widening episode. With HY spreads currently below their long-run average, the risk-reward skews somewhat unfavourably for new HY positions at these levels.
That said, HY is not automatically wrong. If you understand that you are essentially adding a lower-quality, shorter-duration, equity-correlated asset — not a true fixed-income diversifier — then a modest HY allocation within a well-constructed portfolio can add incremental yield without dramatically changing your risk profile. The key is sizing it appropriately (keeping HY as a minority of fixed income) and choosing low-cost, diversified funds.
For investors whose bonds serve as a genuine counterweight to equity risk, IG remains the cleaner choice in 2026. The 2% you give up in yield is the price of diversification — and that price looks reasonable when equity valuations remain stretched and recession risk has not fully subsided. Worth reading next: Short-Term Bonds vs. High-Yield Savings Accounts (2026) if you are also deciding where to park your shorter-term cash.
Found this breakdown useful? Bookmark it so you can revisit when credit conditions shift.
This article is for informational purposes only and is not investment advice. Do your own research before making any investment decisions.