

Inflation was supposed to be beaten by now. Yet heading into 2026, the Consumer Price Index (CPI) remains stubborn — a combination of services-sector wage growth, tariff-driven goods repricing, and a Federal Reserve that has held rates at restrictive levels far longer than most investors expected. If you built a classic 60/40 portfolio and assumed the inflation problem was solved, the numbers on your statement may be telling a different story. An inflation-hedge portfolio — a dedicated sleeve of assets designed to retain purchasing power when prices rise — deserves a serious look in 2026.
This guide breaks down the four most widely used inflation-hedge asset classes — TIPS, gold, REITs, and commodities — and gives you a concrete framework for how to allocate across them. We will look at how each works mechanically, how they have behaved in past inflationary episodes, and how to size each position inside a diversified portfolio. If you want to start from the broader asset allocation basics before diving in, that foundation will make this guide easier to apply.

Why Inflation Hedging Still Matters in 2026
The Inflation Numbers That Won’t Quit
The Federal Reserve’s 2% inflation target seemed within reach in early 2025, only for re-acceleration to arrive by mid-year. As of mid-2026, headline CPI sits in the 3.2–3.8% range depending on the month, well above the target. Core services inflation — which strips out food and energy — has been the stickiest component, running above 4% annualized. The principal culprit is a combination of still-tight labor markets and tariff-driven goods price increases that are passing through supply chains faster than anticipated (Source: U.S. Bureau of Labor Statistics, June 2026).
For investors, inflation above 3% for an extended period is not a minor rounding error. At 3.5% inflation, a dollar of purchasing power today is worth roughly $0.66 in real terms twenty years from now. At 2%, that same dollar is worth $0.67 — still a haircut, but far more manageable. The difference compounds dramatically over time.
What a 1% Inflation Surprise Does to a 60/40 Portfolio
A traditional 60% equity / 40% nominal bond portfolio has a specific vulnerability: the bond portion carries negative real returns whenever inflation exceeds the yield. At current 10-year Treasury yields near 4.5% (Source: U.S. Treasury, July 2026), a portfolio’s bond sleeve earns roughly 1–1.5% above current inflation — a thin real buffer. If CPI re-accelerates to 5%, nominal bonds would immediately generate negative real returns while also losing market value as prices fall in response to rate pressure. Equities can partially compensate — revenues nominally grow with inflation — but sector dispersion is wide, and highly valued growth stocks tend to suffer the most in stagflationary environments. This is precisely the gap that an inflation-hedge sleeve is designed to fill.
The Four Core Inflation-Hedge Asset Classes
TIPS — The Bond Market’s Direct Inflation Link
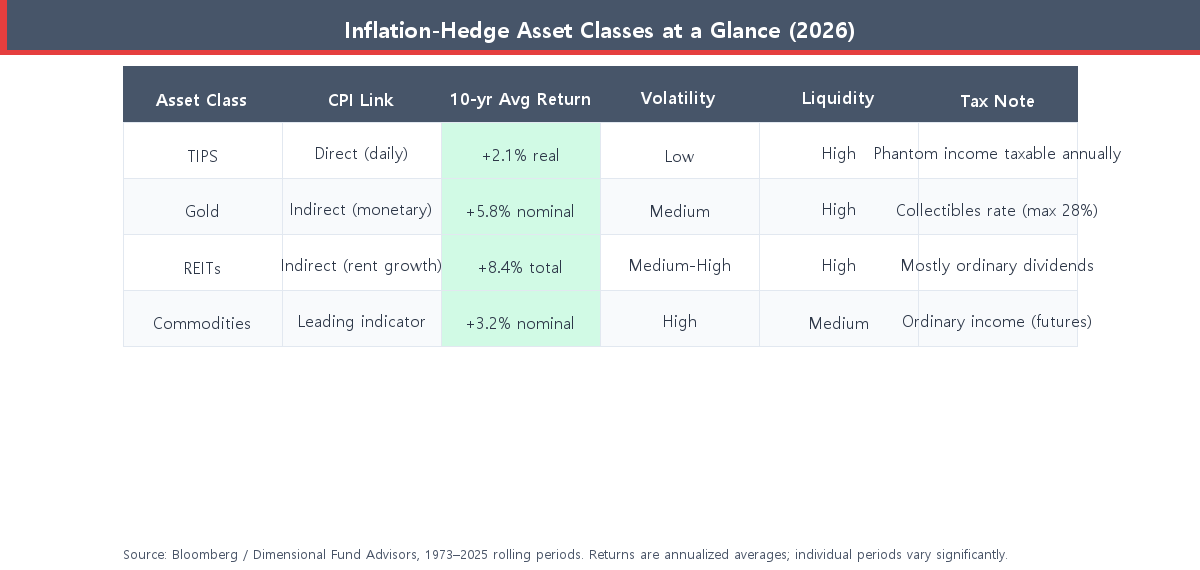
Treasury Inflation-Protected Securities (TIPS) are U.S. government bonds whose principal adjusts daily in line with the CPI. If you hold a $10,000 TIPS and CPI rises 4%, your principal becomes $10,400. The coupon rate (paid semiannually) is fixed, but it is applied to the adjusted principal — so the dollar amount of interest you receive also grows. At maturity, you receive the greater of the original or the inflation-adjusted principal, giving you a floor against deflation.
TIPS are the most mechanically direct inflation hedge available. Their weakness is that they track realized CPI rather than anticipating future inflation — so if inflation expectations are already priced into current real yields (currently around 2.1–2.3% for 10-year TIPS as of July 2026), a significant portion of the hedge value is already in the price. They also underperform nominal Treasuries during disinflationary periods. For a deeper comparison of TIPS against I Bonds — another popular inflation-protection instrument — see our dedicated breakdown: TIPS vs. I Bonds comparison.
Gold — The Classic Monetary Hedge
Gold’s relationship with inflation is often misunderstood. In the short run, gold does not move in lockstep with CPI. Over multi-year periods of monetary disorder — episodes when real interest rates turn sharply negative, currencies weaken, or central bank credibility comes into question — gold has historically been a strong store of value. Spot gold reached new all-time highs above $3,100/oz in early 2026, driven partly by central bank reserve diversification away from the dollar and partly by persistent real rate uncertainty.
The core risk with gold is that it generates no income. Holding gold costs money (storage or ETF expense ratios) and produces nothing if inflation cools and real rates normalize. Academic research (Erb & Harvey, 2013; updated replications through 2025) finds gold’s inflation-hedging efficacy is inconsistent decade to decade. It works well when monetary policy credibility is under pressure; it lags when inflation is moderate and rates rise predictably. That suggests gold deserves a role in an inflation-hedge sleeve but not a dominant one. For a full sizing analysis, see: how much gold to hold in your portfolio.
REITs — Rent Revenue Tracks the CPI
Real Estate Investment Trusts (REITs) own income-producing properties — apartment complexes, office buildings, warehouses, data centers, cell towers — and are required to distribute at least 90% of taxable income as dividends. The inflation-hedge logic is straightforward: when inflation rises, landlords can raise rents, and higher replacement costs for new properties support the value of existing ones. Over the long run, REIT dividends have tended to grow at or above inflation for many property types.
The practical caveat is that REITs are sensitive to interest rates in the short run, because higher rates raise borrowing costs and compress the spread between cap rates and financing costs. In 2022–2023, REITs sold off sharply even as inflation hit 40-year highs, precisely because rates rose faster than rents. In 2025, as the Fed signaled a potential easing path, REITs recovered meaningfully. The lesson: REITs hedge multi-year inflation well but can lag badly during the acute phase of a rate-hiking cycle. For a direct yield-and-return comparison with dividend ETFs, see: REITs vs. dividend ETFs for passive income.
Commodities — Raw Material Price Power
Broad commodity indices (energy, metals, agriculture) often provide the most immediate inflation protection because commodities are themselves an input into CPI calculations. When oil, copper, wheat, and soybeans rise, the CPI follows — sometimes with only a one- to two-month lag. Academic work by Gorton & Rouwenhorst (2006) documented commodities’ historically near-zero correlation with stocks and bonds and positive correlation with unexpected inflation. More recent data through 2025 largely confirms this relationship, though individual commodity markets can be volatile.
The implementation challenge is that direct commodity futures are complex, subject to roll costs in contango markets, and generate ordinary income rather than long-term capital gains. Most retail investors access commodities through diversified ETFs, which absorb the roll mechanics while providing broad exposure. Commodities are the most volatile of the four asset classes in this framework and should be sized accordingly.
How Each Asset Class Performs Across Inflation Regimes
The chart below maps approximate asset class behavior across three inflation environments — moderate (2–3% CPI), elevated (3–5%), and high (5%+) — based on historical rolling periods from 1973 to 2025 (Source: Dimensional Fund Advisors / Bloomberg, January 2026). No single asset class dominates in every environment, which is the core argument for holding all four in combination. TIPS and commodities tend to outperform earliest in an inflation shock; gold often lags and then surges; REITs can initially suffer before rent growth catches up. Holding all four in proportion smooths the combined response.
A Practical Allocation Framework: How Much of Each?
There is no universally correct inflation-hedge allocation. The right size depends on your total portfolio, your existing equity sector exposure (energy stocks and financials carry implicit inflation sensitivity), and your conviction about inflation persistence. The three tiers below offer a structured starting point.
Conservative Hedge (5–10% of Portfolio)
Suited for investors who believe inflation will gradually normalize toward 2% within 12–24 months and want only modest protection. Within this sleeve: allocate roughly half to TIPS (the most predictable hedge), a quarter to gold, and split the remainder between a REIT index fund and a diversified commodity ETF. This tier adds meaningful inflation sensitivity without meaningfully dragging on returns in a disinflationary scenario.
- TIPS: ~5% of total portfolio
- Gold: ~2–3%
- REITs: ~1–2% (if not already present in equity allocation)
- Commodities: ~1%
Moderate Hedge (15–20% of Portfolio)
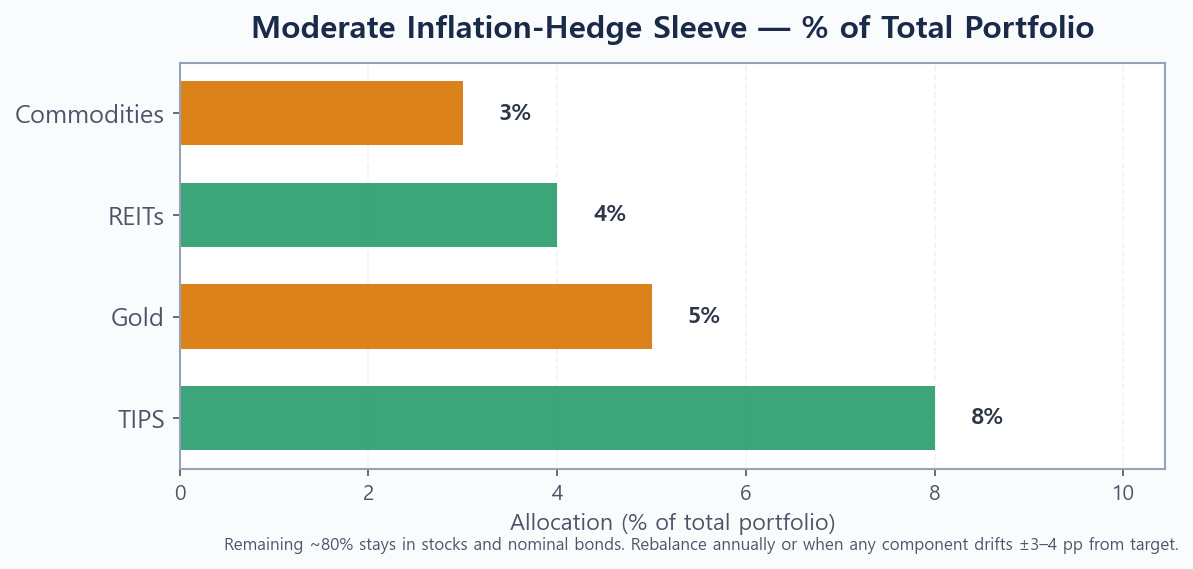
Suited for investors who expect inflation to remain above 3% for two or more years and want a meaningfully protective sleeve without abandoning conventional equity and bond exposure. This is the scenario most consistent with the 2026 macro baseline as of mid-year.
- TIPS: ~8% of total portfolio
- Gold: ~5–7%
- REITs: ~3–5% (replacing or supplementing equity exposure)
- Commodities: ~2–3%
Aggressive Hedge (25–30% of Portfolio)
Suited for investors with a high conviction in a persistent inflationary environment — think 1970s-style stagflation — or those who have large fixed-income exposure that needs direct offset. Note that a 25–30% allocation to inflation assets substantially reduces expected nominal returns in low-inflation environments. This tier is rarely appropriate for investors with a time horizon under ten years unless they have specific liability-matching needs.
- TIPS: ~12%
- Gold: ~8–10%
- REITs: ~5–7%
- Commodities: ~5%
Sample Portfolio Breakdown (Moderate Scenario)
To make the moderate hedge concrete: imagine a $200,000 portfolio currently allocated 60% equities ($120,000) and 40% bonds ($80,000). To create a 15% inflation hedge sleeve, you would redirect approximately $30,000 from nominal bonds into: $16,000 TIPS fund, $10,000 gold ETF, $4,000 split between a REIT ETF and commodity ETF. The remaining nominal bond exposure drops to $50,000, but the overall portfolio gains a meaningful real-return buffer. Annual rebalancing should maintain the target weights as asset prices drift. For a detailed step-by-step rebalancing process, see our guide on how to rebalance your portfolio.
The Best ETFs and Instruments for Each Category (2026)
TIPS ETFs — SCHP vs. TIP vs. VTIP
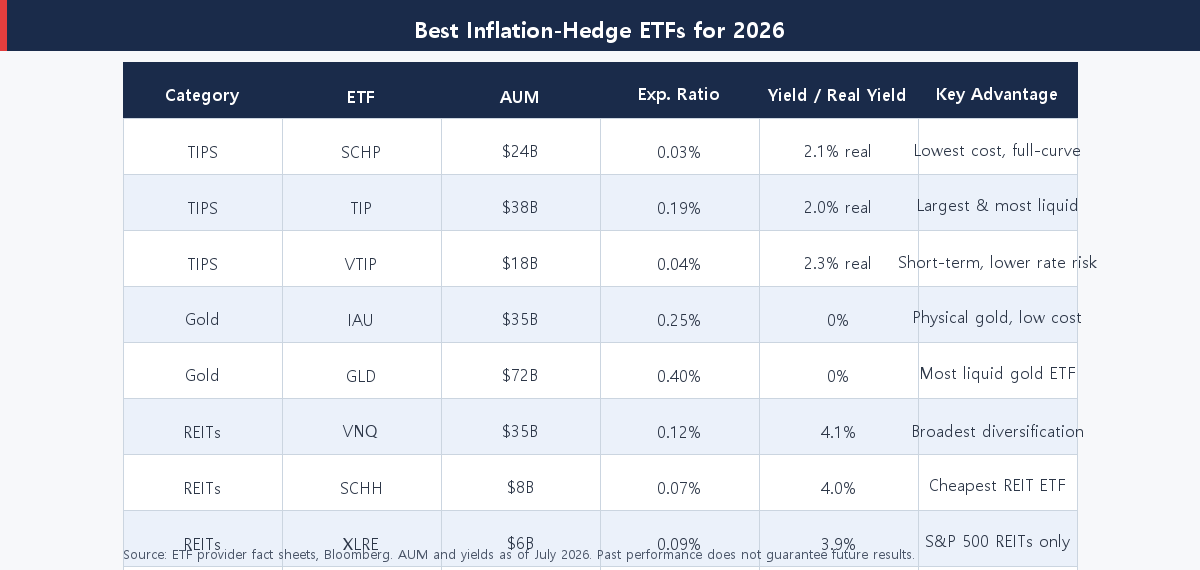
SCHP (Schwab U.S. TIPS ETF) is the low-cost leader at 0.03% expense ratio with roughly $24 billion in AUM, tracking the Bloomberg U.S. TIPS Index (all maturities). TIP (iShares TIPS Bond ETF) — the oldest and largest at $38 billion AUM — charges 0.19% and tracks the same index. VTIP (Vanguard Short-Term Inflation-Protected Securities ETF), at 0.04%, focuses on TIPS with maturities under five years, making it less sensitive to interest rate moves but also less responsive to longer-term inflation expectations. VTIP is the better choice for investors who are concerned about rate risk on top of inflation; SCHP or TIP for those who want full-curve inflation exposure at the lowest cost.
Gold — GLD vs. IAU vs. Physical Gold
GLD (SPDR Gold Shares) at 0.40% expense ratio and IAU (iShares Gold Trust) at 0.25% both hold physical gold bars in vaulted custody. For most retail investors, IAU’s lower cost advantage compounds meaningfully over time. Physical gold (coins, bars) eliminates counterparty risk entirely but introduces storage costs, insurance, and illiquidity at sale. A gold mining ETF such as GDX can offer leveraged gold-price exposure (miners tend to amplify gold moves) but adds equity risk and idiosyncratic company risk — appropriate as a satellite position, not a core hedge.
REIT ETFs — VNQ vs. SCHH vs. XLRE
VNQ (Vanguard Real Estate ETF) is the benchmark REIT ETF — $35 billion AUM, 0.12% expense ratio, broad 165-REIT diversification including specialized sectors (data centers, cell towers, industrial). SCHH (Schwab U.S. REIT ETF) at 0.07% is the cheapest option and tracks a similar universe. XLRE (Real Estate Select Sector SPDR) at 0.09% holds only S&P 500 REITs, giving it a large-cap tilt. For an inflation-hedge sleeve, VNQ or SCHH offer the best diversification-to-cost trade-off. Investors already holding broad U.S. equity ETFs (like VTI) should note that REITs are included there, so an explicit REIT ETF adds incremental rather than entirely new exposure.
Commodity ETFs — DJP vs. PDBC vs. GSG
PDBC (Invesco Optimum Yield Diversified Commodity Strategy No K-1 ETF) is the standout choice for tax simplicity: it avoids the K-1 tax form that most commodity ETFs generate and covers energy, metals, and agriculture with an optimized roll strategy. Expense ratio: 0.59%. GSG (iShares S&P GSCI Commodity-Indexed Trust) at 0.75% offers broad exposure but is heavily weighted toward energy (roughly 60%), meaning it closely tracks oil prices. DJP (iPath Bloomberg Commodity Index Total Return ETN) is more balanced across energy, metals, and agriculture but is a note (counterparty risk) rather than a fund. For most investors, PDBC’s K-1 avoidance and balanced weighting make it the practical default.
Common Mistakes Inflation-Hedge Investors Make
Over-Allocating to a Single Hedge
Gold peaked in 1980 and did not recover in real terms for over two decades. Commodities went through a brutal 2012–2020 bear market even as U.S. inflation averaged 1.8%. REITs fell 37% in 2022 despite 8% inflation. No single inflation hedge works reliably in all environments. The reason to hold all four in proportion is precisely because their failure modes are different — and the combination behaves more consistently than any individual component.
Ignoring the Tax Drag
TIPS accrue “phantom income” — the inflation adjustment to principal is taxable in the year it accrues, even though no cash is received until maturity. This makes TIPS significantly more tax-efficient inside an IRA or 401(k) than in a taxable brokerage account. Gold ETFs held over one year are taxed at the collectibles rate (28% maximum federal) rather than the standard long-term capital gains rate — another argument for sheltering gold inside tax-advantaged accounts when possible. REITs distribute most income as ordinary dividends (not qualified), so they also belong in tax-sheltered accounts when feasible.
Rebalancing Too Infrequently
Inflation assets can move dramatically relative to one another. Gold may surge 30% while TIPS returns 5% in the same year. Without rebalancing, an intended 5%/3%/2%/2% allocation drifts to an accidental 8%/2%/1%/1% — turning a balanced inflation sleeve into a gold-heavy bet. Annual rebalancing (or drift-band rebalancing when any component moves more than 3–4 percentage points from target) keeps the diversification intact.
Putting It All Together: Building Your Inflation Sleeve
Building a well-constructed inflation-hedge portfolio in 2026 does not require abandoning your existing equity and bond positions. It requires carving out a thoughtful sleeve — 10–20% for most investors — and populating it with four complementary assets: TIPS for direct CPI linkage, gold for monetary hedge properties, REITs for long-run rent-driven income growth, and broad commodities for immediate price-shock coverage. Each works differently, fails differently, and complements the others.
The right sizing depends on your macro view, your tax situation, and whether your existing portfolio already carries implicit inflation exposure through energy stocks, commodity producers, or floating-rate bonds. Start with the moderate tier (15–20%) if you believe elevated inflation persists, and trim toward the conservative tier (5–10%) as macroeconomic data turns. If you are newer to portfolio construction, the simple 3-fund portfolio guide lays out the foundation that an inflation sleeve sits on top of.
Bookmark this page to revisit when CPI data drops each month — the case for this inflation-hedge allocation grows and shrinks with the macro environment, and keeping the framework handy makes it easier to act decisively when conditions shift.
This article is for informational purposes only and is not investment advice. All figures cited are from publicly available sources (U.S. BLS, U.S. Treasury, Bloomberg, fund provider fact sheets) as of July 2026 and are subject to change. Do your own research before making any investment decision.