
Most investors who hold VOO, IVV, or SPY consider themselves well-diversified. They own a slice of 500 companies, after all. But here’s the uncomfortable truth: in 2026, the S&P 500 ETF concentration risk embedded in these funds is at historically elevated levels — and a single sector shock could deal a far bigger blow to your portfolio than the word “index fund” implies. Understanding this risk, and knowing your options, is one of the most important portfolio conversations you can have this year.
What Is Index Concentration Risk? (And Why It’s at a Record High)
Index concentration risk is the danger that a small number of holdings account for a disproportionately large share of your portfolio — meaning that if those holdings fall, your entire “diversified” fund falls with them. The S&P 500 has always had some concentration, but the current level is exceptional by any historical standard.
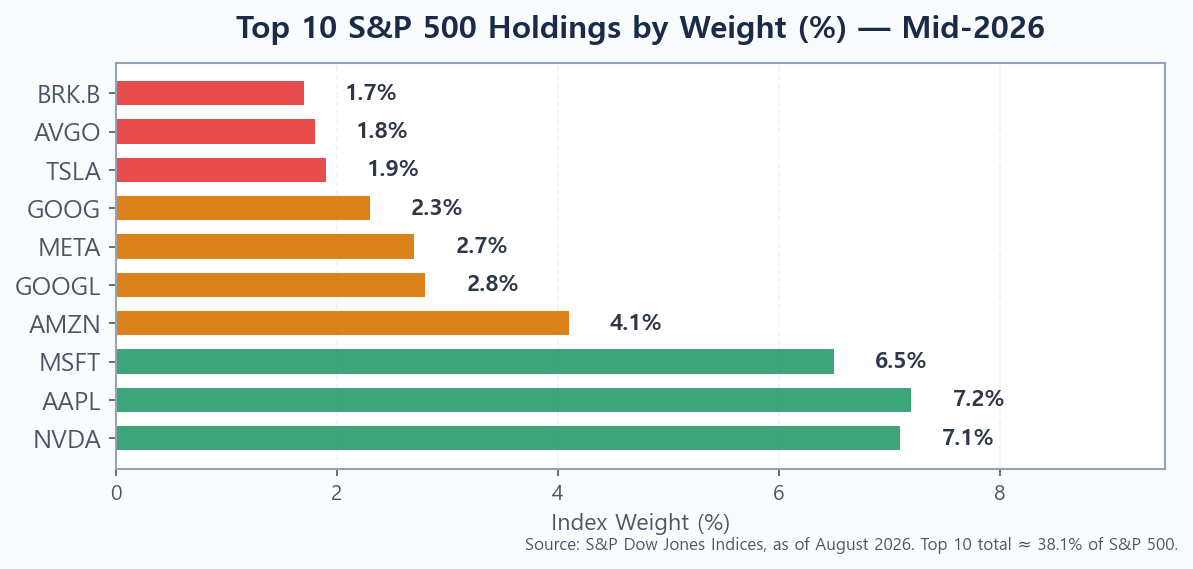
How the Top 10 Stocks Now Control ~38% of the S&P 500
As of mid-2026, the top 10 holdings in the S&P 500 — led by NVIDIA, Apple, Microsoft, Amazon, Alphabet, and Meta — represent approximately 38% of the entire index (Source: S&P Dow Jones Indices, as of August 2026). The Magnificent Seven alone account for roughly 34%. Technology-related stocks make up around 38% of VOO’s total weight.
Put simply: when you buy a single share of VOO, nearly four dimes of every dollar go to just ten companies. The remaining 490 companies share the other 62 cents.
The Passive Investing Feedback Loop That Makes It Worse
Here’s the mechanism that many investors don’t see: every new dollar flowing into an S&P 500 ETF is automatically allocated by market capitalization. As NVIDIA’s price rises, its weight in the index rises. As its weight rises, index funds must buy more of it. More buying pushes the price higher still. This feedback loop accelerates concentration over time — entirely independent of whether those companies are fairly valued.
Goldman Sachs strategist David Kostin noted that “high concentration today portends much lower S&P 500 returns over the next decade than would have been the case in a less concentrated market.” That’s a warning worth sitting with if you’re planning a 10–20 year retirement timeline.
The Real-World Risks Most Investors Overlook
The academic case for diversification is well understood. The practical risk — the scenario that actually plays out in real portfolios — is less often discussed. Two in particular are worth examining.
One Sector Shock Can Gut Your “Diversified” Portfolio
Imagine an antitrust ruling against Big Tech, a sudden AI regulatory clampdown, or a geopolitical event that hammers semiconductor supply chains. Any of these could send NVIDIA, Apple, and Microsoft down 20–30% in a matter of weeks. With those three names alone representing over 20% of the S&P 500, a market-cap-weighted ETF would absorb a meaningful hit — even if the remaining 490 companies barely moved.
Many investors who think they’re diversified across sectors are actually carrying heavy hidden exposure to a single cluster of technology mega-caps. If you also hold QQQ, a tech-sector ETF, or individual shares of any Magnificent Seven company, that overlap is even greater. You can check this using a portfolio overlap tool — the results are often sobering. See also: How to Protect Your Portfolio From an AI Bubble (2026) for a deeper look at auditing Magnificent Seven exposure.
Historical Parallel: Lessons From the 2000 Tech Bubble
We’ve seen this story before. In early 2000, the S&P 500’s top 10 holdings — dominated by Cisco, Intel, Microsoft, and General Electric — comprised roughly 26% of the index. That was considered elevated at the time. After the dot-com bust, the S&P 500 declined about 49% from peak to trough, with tech stocks at the epicenter losing far more.
Today’s concentration is higher, and the companies involved are more profitable — so this isn’t a direct parallel. But the underlying dynamic is similar: a handful of winners attract ever-larger capital flows, valuations stretch, and the index’s fate becomes increasingly tied to a few decision-makers in a few boardrooms.
Is the S&P 500 Too Concentrated to Be Safe? (Video)
The video below takes a data-driven look at how index concentration has evolved and what the research suggests about forward returns — well worth 15 minutes if you want the quantitative case laid out clearly.
5 Proven Strategies to Fix Concentration Risk Without Abandoning the S&P 500
The good news: you don’t need to sell your VOO or reinvent your portfolio from scratch. The goal is to layer in complementary holdings that reduce your dependence on a small cluster of mega-caps. Here are five strategies to consider, arranged from simplest to most structural.
1. Pair VOO With an Equal-Weight ETF (RSP)
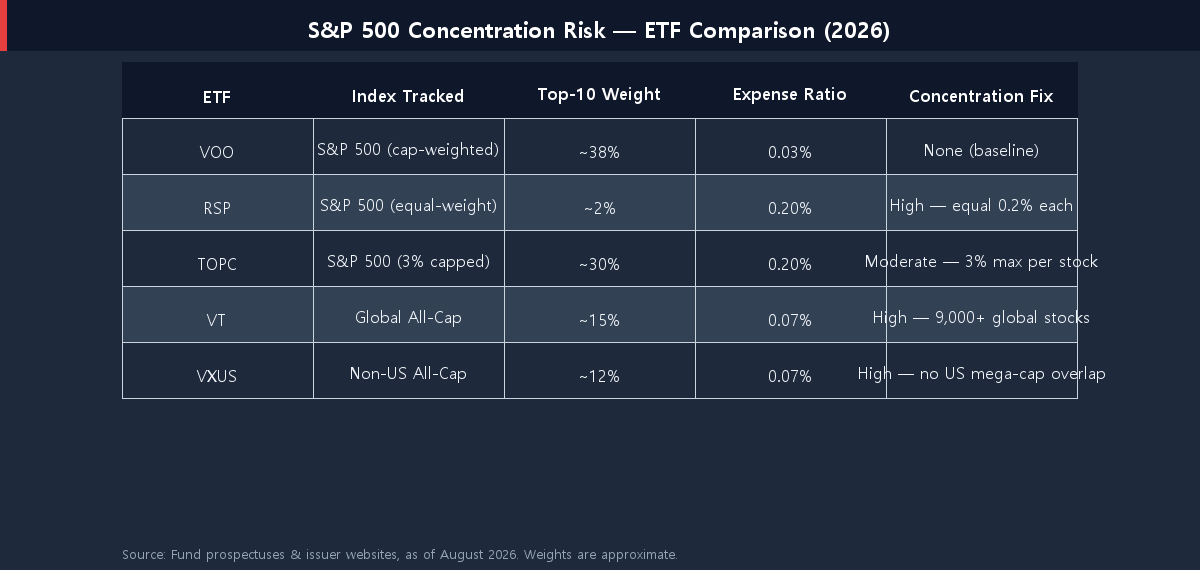
The Invesco S&P 500 Equal Weight ETF (RSP) holds the same 500 companies as the S&P 500 — but allocates an equal ~0.2% to each one, completely eliminating the cap-weighted feedback loop. Apple and a mid-size industrial company get the same dollar weight. This forces automatic rebalancing toward cheaper, smaller companies as the index shifts.
RSP does carry a higher expense ratio (0.20% vs VOO’s 0.03%) and has historically underperformed during Magnificent Seven-led rallies. But it has outperformed meaningfully in years when mega-cap leadership rotates. Many investors allocate 20–30% of their U.S. equity allocation to RSP alongside their core VOO position. For the full comparison of these two approaches, see our deep-dive: Equal-Weight vs Market-Cap ETF in 2026.
2. Add a Small-Cap Tilt (IJR, VB)
Small-cap stocks sit almost entirely outside the mega-cap concentration problem. The iShares S&P SmallCap 600 ETF (IJR) or Vanguard Small-Cap ETF (VB) give you exposure to 600–1,400 smaller U.S. companies, with the top 10 holdings typically representing just 4–5% of assets — a fraction of the S&P 500’s 38%.
Small-caps have historically delivered higher long-term returns than large-caps, though with greater volatility. An allocation of 10–15% to small-caps meaningfully lowers your overall portfolio’s dependence on tech mega-caps while adding a return-enhancing factor tilt.
3. Go International (VXUS, VYMI)
Non-U.S. stocks offer perhaps the most straightforward antidote to S&P 500 concentration. The Vanguard Total International Stock ETF (VXUS) spans over 8,000 companies across developed and emerging markets, where the Magnificent Seven simply don’t exist. The MSCI EAFE index currently trades at roughly 16x forward P/E versus ~22x for the S&P 500 — a valuation gap that has attracted growing attention from institutional investors.
If you also want income alongside the diversification, Best International Dividend ETFs for 2026 covers VYMI, SCHY, IDV, and other options yielding 4–6% with broad geographic spread.
4. Shift a Slice to Dividend or Value ETFs
Dividend-focused ETFs like SCHD, VYM, or SPYD are structurally underweight technology because tech giants typically don’t pay meaningful dividends. SCHD’s top sector is industrials and financials, giving you natural concentration relief without requiring you to make any explicit sector bet.
Value ETFs like VTV or IVE tilt toward lower-P/E names — which in 2026 means less of NVIDIA and more of healthcare, energy, and financials. If you’re comparing high-dividend options, our analysis at SPYD vs VYM vs SCHD: Best High-Dividend ETF for 2026? breaks down the trade-offs on yield, fees, and 10-year returns.
5. Consider a Factor-Based or Capped Index ETF
A newer option gaining traction is the iShares S&P 500 3% Capped ETF (TOPC), which holds all S&P 500 companies but limits any single position to a 3% maximum weight. This keeps the portfolio close to the S&P 500’s risk-return profile while trimming the most extreme mega-cap positions. Expense ratios are higher than plain vanilla index funds, but the tracking error versus the S&P 500 is far lower than equal-weight alternatives.
For investors who want to stay entirely within the S&P 500 universe but reduce tail risk from individual giants, TOPC represents a middle path between VOO and RSP.
Sample “Concentration-Adjusted” Portfolio Allocations
Below are four illustrative allocation frameworks for investors at different risk tolerances who want to reduce S&P 500 ETF concentration risk while maintaining growth exposure. These are not personalized recommendations — they’re starting points for your own research and conversation with a financial advisor.
| Profile | VOO / IVV | RSP (Equal-Weight) | Small-Cap (IJR/VB) | International (VXUS) | Dividend/Value (SCHD/VTV) |
|---|---|---|---|---|---|
| Aggressive Growth | 50% | 20% | 15% | 15% | 0% |
| Balanced Growth | 40% | 15% | 10% | 20% | 15% |
| Conservative Growth | 30% | 10% | 5% | 25% | 30% |
| Income-Tilted | 25% | 10% | 5% | 20% | 40% |
The “Aggressive Growth” profile keeps a dominant S&P 500 core but adds equal-weight and small-cap tilts to broaden the return drivers. The “Income-Tilted” profile significantly shifts toward dividend-paying ETFs that are structurally underweight the Magnificent Seven. Each of these frameworks can be fine-tuned based on your timeline, tax situation, and existing holdings.
The Bottom Line: Don’t Panic — But Don’t Ignore This Either
The S&P 500 has delivered exceptional returns over the past decade, and the companies driving its concentration — Apple, NVIDIA, Microsoft — are genuinely profitable, cash-generative businesses. This isn’t 1999-era speculation. But S&P 500 ETF concentration risk in 2026 is real, measurable, and higher than at almost any point in history.
The case for action isn’t that a crash is coming. The case is that a truly diversified portfolio shouldn’t have 38% of its equity allocation hinging on ten companies in overlapping sectors. Small, deliberate adjustments — adding RSP, layering in VXUS, tilting toward dividends — can meaningfully improve your portfolio’s resilience without abandoning the low-cost index approach that works over time.
If you want to take the next step and build a complete, well-structured equity portfolio from the ground up, How to Build a Simple 3-Fund Portfolio in 2026 walks through the entire framework — three ETFs, one annual rebalance, and a setup guide for Vanguard, Fidelity, and Schwab.
This article is for informational purposes only and is not investment advice. All ETF data and index weights are approximate and sourced from public disclosures as of August 2026. Consult a qualified financial advisor before making investment decisions.