
Two inflation numbers land on investors’ screens every month — and in 2026 they are telling very different stories. The Consumer Price Index (CPI) for July 2026 printed at 3.4% year-over-year (Source: Bureau of Labor Statistics, August 12, 2026), while the Personal Consumption Expenditures (PCE) index for the same month came in at 3.7% headline and 3.3% core (Source: Bureau of Economic Analysis, August 27, 2026). That gap — PCE running above CPI — is one of the widest reversals of the historical norm since 1985. With the Federal Reserve’s September 15–16 FOMC meeting fast approaching, markets currently price roughly a 62% probability that the Fed holds its target range at 3.50%–3.75%. Understanding exactly which inflation measure drives that decision is the most important macro skill investors can develop right now.
What Is CPI — And Why Markets Watch It So Closely
The Consumer Price Index is published monthly by the Bureau of Labor Statistics and is the inflation measure most investors encounter first. It tracks price changes in a fixed “basket” of goods and services that represents typical spending patterns of urban American households. The CPI is released roughly two weeks before the PCE reading, which alone explains much of its outsized market impact.
The CPI Basket: Who and What It Measures
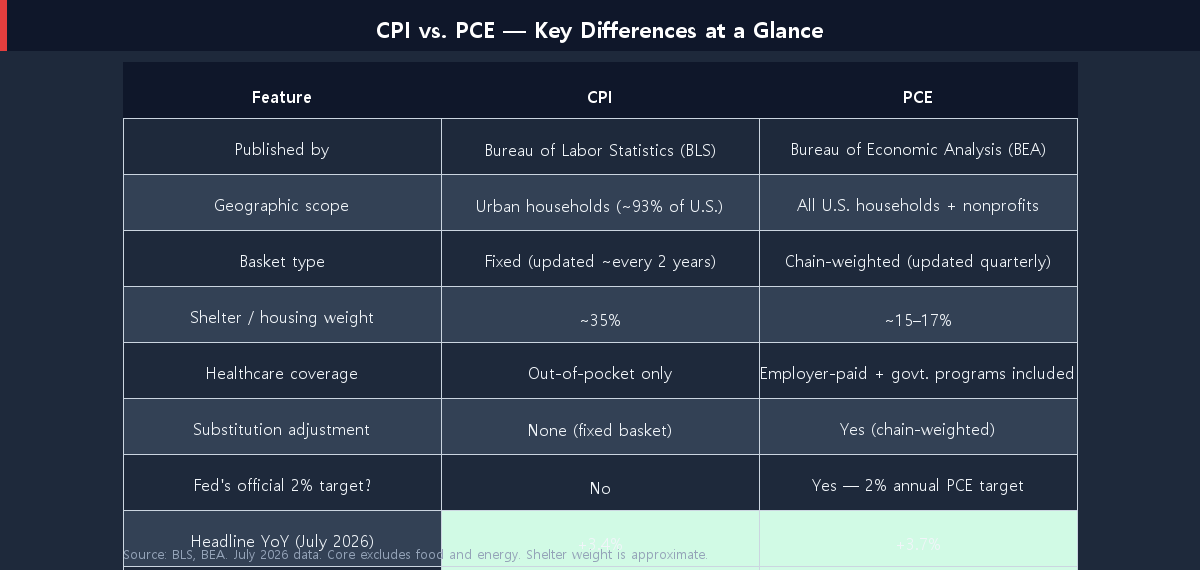
CPI covers approximately 93% of the U.S. population — specifically urban households. Its basket is updated every two years using Consumer Expenditure Survey data, which means it reflects spending patterns from the recent past, not the present moment. The single largest component is housing and shelter, which carries a weight of roughly 35% in the overall index. Medical care in the CPI covers only out-of-pocket costs paid directly by consumers; employer-provided health insurance and Medicare spending are excluded entirely.
That structural limitation matters. Healthcare represents a far larger share of U.S. GDP than the CPI captures. For the full picture of where consumers — and the economy — are actually spending money, the PCE does a more comprehensive job.
Why CPI Triggers Immediate Market Volatility
Despite its structural gaps, CPI moves markets because it comes first and is widely understood. A hotter-than-expected CPI print sends 2-year Treasury yields sharply higher, drops bond prices, and typically pressures growth stocks within minutes of release. For short-term traders, CPI is the event. For long-term Fed watchers, however, CPI is the opening act — and PCE is the main stage. If you want a deeper look at how rate-sensitive assets respond to Fed data, How Fed Rate Decisions Affect the Stock Market walks through the four transmission channels in detail.
What Is PCE — And Why the Fed Prefers It
The Personal Consumption Expenditures price index is compiled by the Bureau of Economic Analysis from business-side data — what companies actually report selling, rather than what households report buying. Its scope is broader: PCE covers all U.S. households, including rural areas, and also captures spending by nonprofit institutions on behalf of households. That includes the cost of employer-sponsored health insurance, Medicare and Medicaid payments, and other healthcare spending that never appears in a consumer’s out-of-pocket bill.
Chain-Weighting: PCE’s Key Advantage Over a Fixed Basket
The most technically important difference between CPI and PCE is how each index handles substitution. CPI uses a fixed basket — if beef prices surge, CPI keeps tracking beef at its original weight, even if consumers have switched to chicken. This is called substitution bias, and it causes CPI to slightly overstate inflation when consumers adapt their behavior.
PCE uses a chain-weighted methodology, updating its basket quarterly. If steak becomes expensive and consumers shift to chicken, PCE captures that behavioral change quickly, reflecting actual spending rather than theoretical spending. This makes PCE a more accurate — and slightly lower — measure of true inflation under normal conditions. In 2026, as we’ll see, conditions are far from normal.
The Fed’s Official 2% PCE Target
The Federal Open Market Committee’s policy statement explicitly reads: “The Committee seeks to achieve maximum employment and inflation at the rate of 2 percent over the longer run, as measured by the annual change in the price index for personal consumption expenditures.” There is no ambiguity. The Fed’s 2% target is a PCE target, not a CPI target. When Chair Powell says inflation is “still too high,” he is looking at core PCE — currently at 3.3% (Source: BEA, July 2026), a full 130 basis points above the 2% mandate. That gap is why a September rate cut remains the minority view despite CPI’s more favorable read.
CPI vs. PCE Side by Side: July 2026 Data
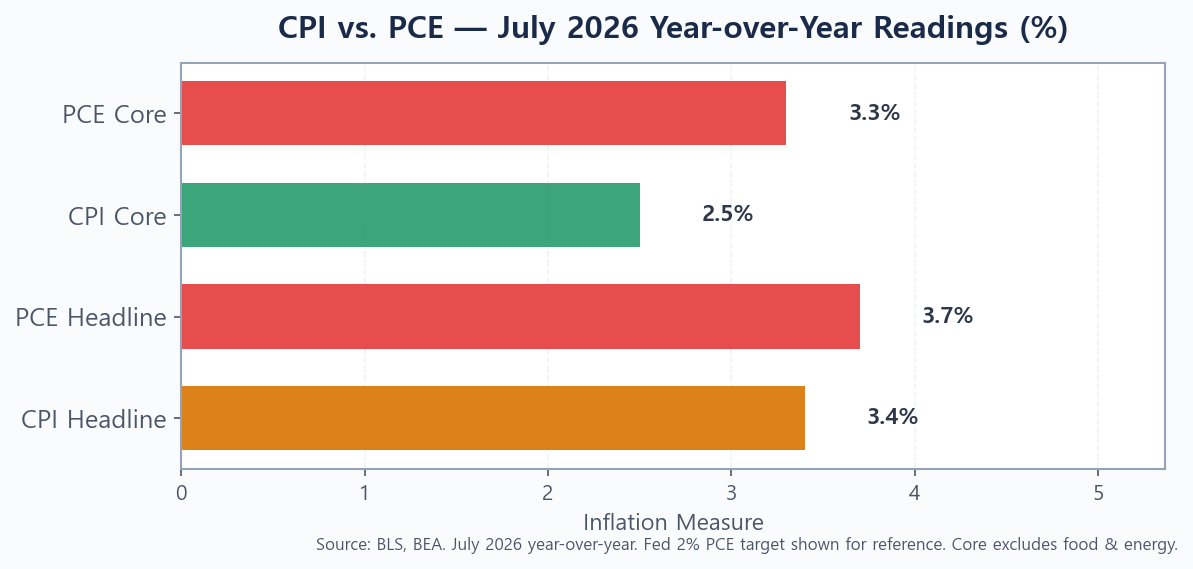
The July 2026 readings put the CPI vs. PCE divergence in sharp relief. CPI headline came in at 3.4% year-over-year, down from 3.5% in June, with a monthly gain of just 0.1% (Source: BLS, August 12, 2026). Core CPI — stripping out food and energy — eased to 2.5% from 2.6%, a relatively benign read that briefly lifted risk assets on release day. PCE headline, released two weeks later, told a different story: 3.7% year-over-year with a monthly increase of 0.2% (Source: BEA, August 27, 2026). Core PCE held at 3.3%, arriving 0.1 percentage point above the Dow Jones forecast on the headline line while core landed in line.
The gap between CPI core (2.5%) and PCE core (3.3%) — 80 basis points, with PCE above CPI — is the signal that most retail investors are missing. In any normal year, PCE runs 20 to 40 basis points below CPI. The 2026 inversion is the story.
The 2026 Anomaly — Why PCE Is Running Hotter Than CPI
Three structural factors explain why PCE is running above CPI in 2026 — an anomaly not seen at this magnitude since 1985.
1. Shelter data distortion. CPI’s shelter component (roughly 35% of the index) caught a one-time downward adjustment in early 2026 related to revised rental data following the October 2025 government shutdown, which delayed BLS surveys and resulted in a later catch-up effect. The BEA’s housing inputs in PCE are derived from different source data and did not experience the same timing distortion. The result: CPI shelter fell faster than PCE housing, pulling overall CPI lower relative to PCE.
2. Healthcare inflation. PCE’s broader healthcare weight captures employer-paid premiums and government program costs. In 2026, hospital service prices rose sharply following retroactive CMS rate adjustments. Those increases flow quickly into PCE but barely register in CPI’s narrower out-of-pocket healthcare component.
3. Financial services and tariff pass-through. PCE captures imputed financial services costs (e.g., bank fees implicitly paid through interest rate spreads) and covers a slightly different composition of discretionary goods. Tariff-driven price increases — concentrated in imported consumer goods — have passed through the goods basket in a pattern that slightly inflates PCE relative to CPI. For a detailed breakdown of how tariffs are feeding into core inflation in 2026, see How Tariffs Are Fueling Sticky Inflation in 2026.
What the CPI/PCE Divergence Means for the September 15–16 FOMC Decision
The September 2026 FOMC meeting (September 15–16, announcement at 2:00 PM ET on September 16) is a “dot plot” meeting — one of four per year where the Committee releases its Summary of Economic Projections (SEP). That makes September more consequential than a typical meeting: whatever the Fed signals about the path of rates through 2027 will reset market expectations for months.
Markets are currently pricing approximately a 62% probability that the Fed holds at 3.50%–3.75%. The logic: CPI’s 2.5% core read looks close to target, but Fed officials have been explicit that they watch PCE. With core PCE at 3.3%, a 130-basis-point gap above the 2% mandate, the data simply does not yet justify a cut. A rate hold paired with a neutral-to-hawkish press conference — potentially revising the dot plot’s 2026 cut projections upward — is the base case. For context on what the dot plot showed in June and what’s changed since, see Will the Fed Cut Rates in 2026? Reading the Dot Plot.
The key dates to mark on your calendar before September 16: the August CPI release (around September 10–11) and the final PCE-adjacent data from the August JOLTS and payrolls report (around September 5). Either a sharp upside or downside surprise could shift the 62% hold probability meaningfully in either direction.
The video below explains the mechanics of CPI vs. PCE clearly and is worth watching before any FOMC week:
Portfolio Strategy: How to Position Around CPI and PCE Release Dates
Understanding CPI vs. PCE is not just academic — it shapes where returns are won and lost around data releases. Here are four practical considerations for the current environment.
Inflation-protected assets. With PCE core stubbornly above 3%, the case for Treasury Inflation-Protected Securities (TIPS) and I Bonds remains intact. PCE is the real-world inflation benchmark that TIPS are effectively hedging against. TIPS vs. I Bonds: Best Inflation Protection for 2026 compares the two in detail, including the current real yield spread.
Duration risk. Long-duration bonds are most vulnerable when PCE stays elevated. With the 10-year Treasury yield sensitive to both near-term rate expectations and long-run inflation anchoring, a PCE core persistently at 3%+ supports keeping duration shorter than benchmark. Short-duration bond funds and Treasury ladders remain the defensive posture until PCE trends clearly below 3%.
Equity sectors. Financial stocks and dividend growth companies with pricing power typically outperform in a higher-for-longer rate environment. Utilities and rate-sensitive REITs carry more risk when PCE keeps the Fed on hold. The July 2026 FOMC Preview outlined specific sector positioning strategies that remain relevant through September.
Mark your CPI and PCE calendars. CPI for August 2026 releases around September 10–11. PCE for August 2026 will arrive in late September, after the FOMC decision. That sequencing means September’s FOMC will be decided largely on July PCE data (already in hand) plus August CPI — not the final August PCE read. Knowing that asymmetry helps you frame the committee’s information set accurately.
Conclusion: Watch Both — But Follow the Fed
The CPI vs. PCE debate is not about which measure is “right” — both are measuring real price changes across different scopes and methodologies. For short-term market reaction, CPI matters more because it arrives first and is priced into futures markets within milliseconds of release. For the Fed’s actual policy decisions, PCE is the official scorecard, and the current 3.3% core PCE reading is the number keeping the FOMC’s finger off the rate-cut trigger.
The 2026 anomaly — PCE running above CPI by up to 80 basis points — is a reminder that these two gauges can diverge materially and that the divergence matters enormously for investors trying to forecast the Fed’s next move. As September 16 approaches, the question is not whether CPI looks better than it did six months ago. The question is whether the Fed’s own gauge — core PCE — is trending persuasively toward 2%. As of July 2026, the answer is not yet.
Found this useful? Bookmark it so you can revisit when the next CPI or PCE print drops. I publish practical investing breakdowns regularly — check back soon.
This article is for informational purposes only and is not investment advice. Do your own research.